

Is Terreno Realty (TRNO) Undervalued As Fresh Leases Support Its $71 Price?
Terreno Realty Corporation TRNO | 0.00 |
Terreno Realty (TRNO) has been active on the leasing front, most recently securing an early renewal for 34,000 square feet in Jamaica Queens, New York, with a logistics and transportation services provider.
These leasing wins come as Terreno Realty’s share price shows firm momentum, with a 1-month share price return of 5.74% and a year to date share price return of 20.52%, alongside a 1-year total shareholder return of 29.65%. This points to investors reassessing the company’s income visibility and risk profile.
If this kind of steady leasing story appeals to you, it could be a useful moment to broaden your watchlist with 18 top founder-led companies
After Terreno Realty’s strong run and a cluster of fresh leases in key markets, the focus is shifting from operational questions to price. At around $71, investors may now be weighing whether the current valuation offers sufficient upside for new buyers.
Price-to-Earnings of 17.9x: Is it justified?
Terreno Realty now trades on a P/E of 17.9x, with the share price close to $71, which places the stock at a premium to the global Industrial REITs average and below the broader US market average.
The P/E ratio compares the current share price to earnings per share and is a quick way of seeing how much investors are paying for each dollar of profit. For a company like Terreno Realty, which focuses on industrial real estate in major coastal markets and pays a 2.92% dividend, earnings-based valuation is a common reference point for investors weighing income and growth expectations.
Here, the picture is mixed. On one hand, Terreno Realty’s P/E of 17.9x is below the US market average of 19.2x and below the peer average of 32.7x, which suggests the stock is not priced as aggressively as many comparable companies. On the other hand, the same 17.9x P/E is above the Global Industrial REITs industry average of 16.2x, indicating investors are still willing to pay more than the sector average for its earnings profile. Relative to the estimated fair P/E of 24.7x, the current multiple is well under that level, implying there is room for the market to move closer to that fair ratio if the narrative around earnings holds.
Result: Price-to-Earnings of 17.9x (ABOUT RIGHT)
However, Terreno Realty’s narrative could be tested if its annual net income, which currently reflects a decline, or its early lease terminations begin to pressure earnings stability.
Another View: Terreno Realty Through a Cash Flow Lens
While Terreno Realty looks reasonably placed on a P/E of 17.9x, the SWS DCF model paints a cooler picture. At $71.13, the stock sits above an estimated future cash flow value of $66.78, suggesting a degree of overvaluation that puts more weight on execution and sentiment than on cash flows.
For investors who put cash generation at the center of their process, this gap can signal either a risk of disappointment or a price that assumes more than the model does. The key question is which side of that trade you are on.
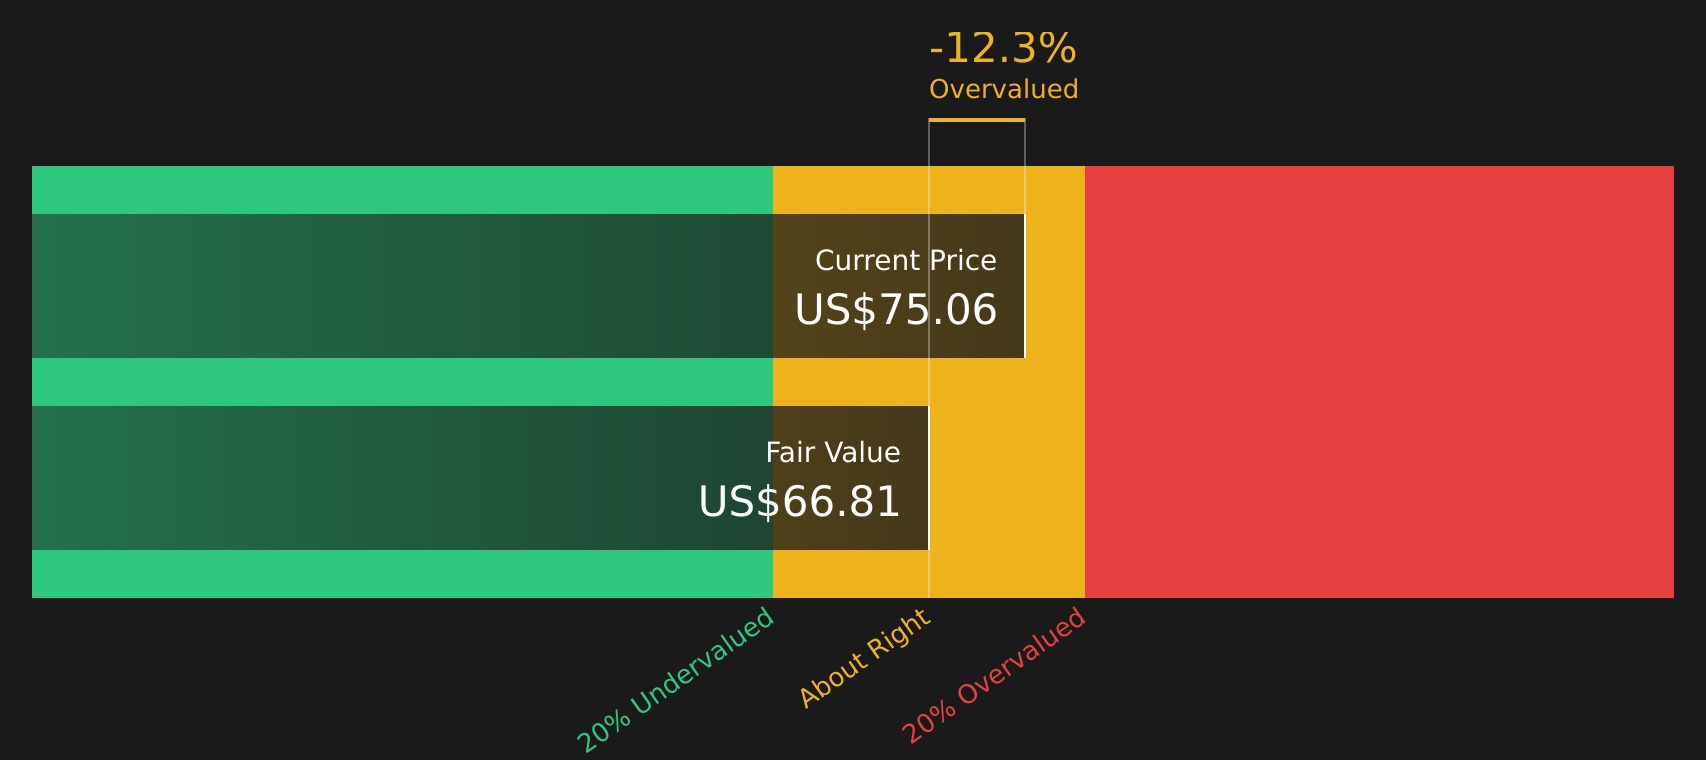
Simply Wall St performs a discounted cash flow (DCF) on every stock in the world every day (check out Terreno Realty for example). We show the entire calculation in full. You can track the result in your watchlist or portfolio and be alerted when this changes, or use our stock screener to discover 44 high quality undervalued stocks. If you save a screener we even alert you when new companies match - so you never miss a potential opportunity.
Next Steps
With Terreno Realty showing both strengths and pressure points, it makes sense to check the underlying data now and decide where you stand, especially as the company currently presents a mix of potential concerns and attractions that investors are debating on both sides, summed up neatly in these 3 key rewards and 2 important warning signs
Looking for more investment ideas beyond Terreno Realty?
Terreno Realty’s story is just one angle. If you want a broader set of opportunities, use these curated screeners so you are not relying on a single stock.
- Target resilient cash generators by scanning companies with healthy finances and consistent fundamentals through the solid balance sheet and fundamentals stocks screener (48 results).
- Spot potential mispricings by reviewing the 44 high quality undervalued stocks that combine quality metrics with attractive valuations.
- Get ahead of the crowd by searching a screener containing 20 high quality undiscovered gems before they attract wider attention.
This article by Simply Wall St is general in nature. We provide commentary based on historical data and analyst forecasts only using an unbiased methodology and our articles are not intended to be financial advice. It does not constitute a recommendation to buy or sell any stock, and does not take account of your objectives, or your financial situation. We aim to bring you long-term focused analysis driven by fundamental data. Note that our analysis may not factor in the latest price-sensitive company announcements or qualitative material. Simply Wall St has no position in any stocks mentioned.