Is Teva (TEVA) Still Reasonably Priced After A 195% Three Year Share Price Gain
Teva Pharmaceutical Industries Limited Sponsored ADR TEVA | 30.08 | -0.56% |
- If you are wondering whether Teva Pharmaceutical Industries is still reasonably priced after its recent run, this article will walk through what the current share price might be implying about value.
- Teva's stock last closed at US$32.47, with returns of 1.1% over 7 days, 9.0% over 30 days, 4.9% year to date, 54.8% over 1 year and 194.6% over 3 years. This naturally raises questions about how much of the story is already reflected in the price.
- Recent coverage has focused on Teva as investors reassess large pharmaceutical names and their pipelines, while generic and specialty drug makers such as Teva remain part of that conversation. This context helps explain why price moves in the sector often come alongside renewed interest in long term drug portfolios, legal overhangs and balance sheet strength.
- On our simple valuation checklist, Teva currently scores 2 out of 6. Next, we will look at how different valuation methods frame that score, before finishing with a way to tie those numbers into a clearer long term view of the stock.
Teva Pharmaceutical Industries scores just 2/6 on our valuation checks. See what other red flags we found in the full valuation breakdown.
Approach 1: Teva Pharmaceutical Industries Discounted Cash Flow (DCF) Analysis
A Discounted Cash Flow model estimates what a business could be worth by projecting its future cash flows and then discounting them back to today’s dollars. It is essentially asking what Teva Pharmaceutical Industries' future cash generation might be worth right now.
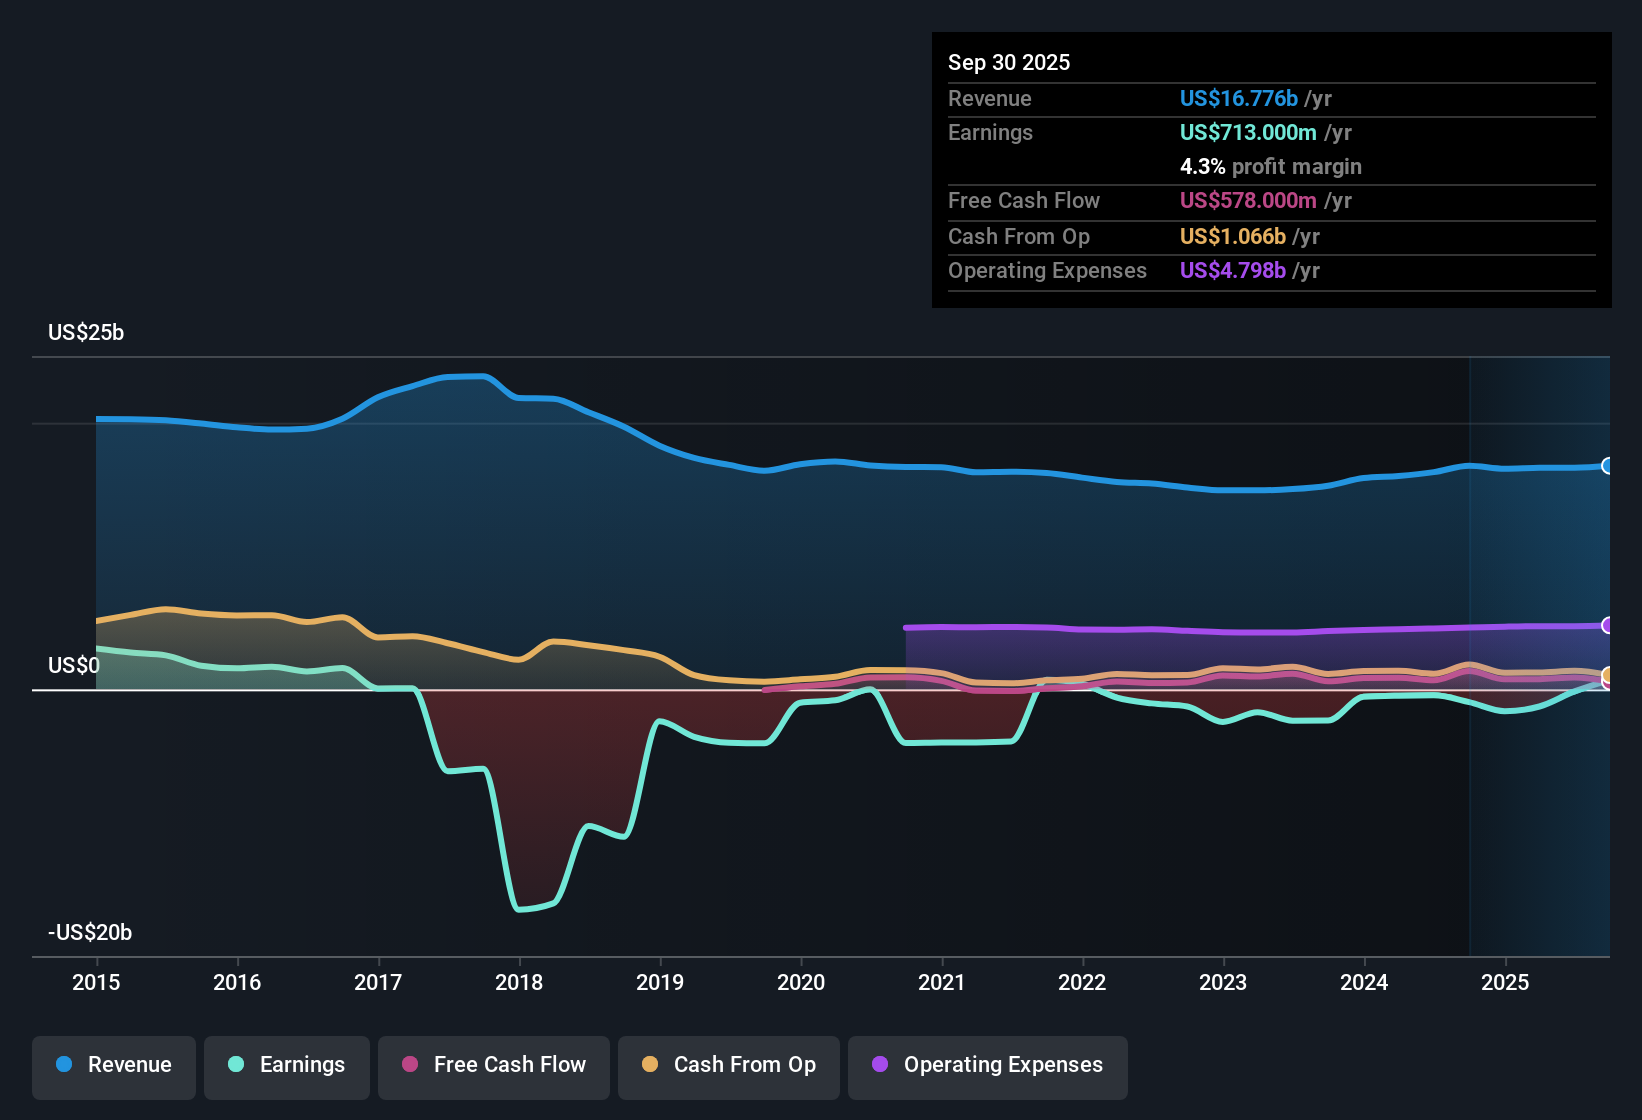
For Teva, the model uses a 2 Stage Free Cash Flow to Equity framework. The latest twelve month free cash flow is about $542 million. Analysts provide explicit forecasts for the next few years, and beyond that, cash flows such as the projected $4.8 billion in 2030 are extrapolated based on those estimates and then discounted.
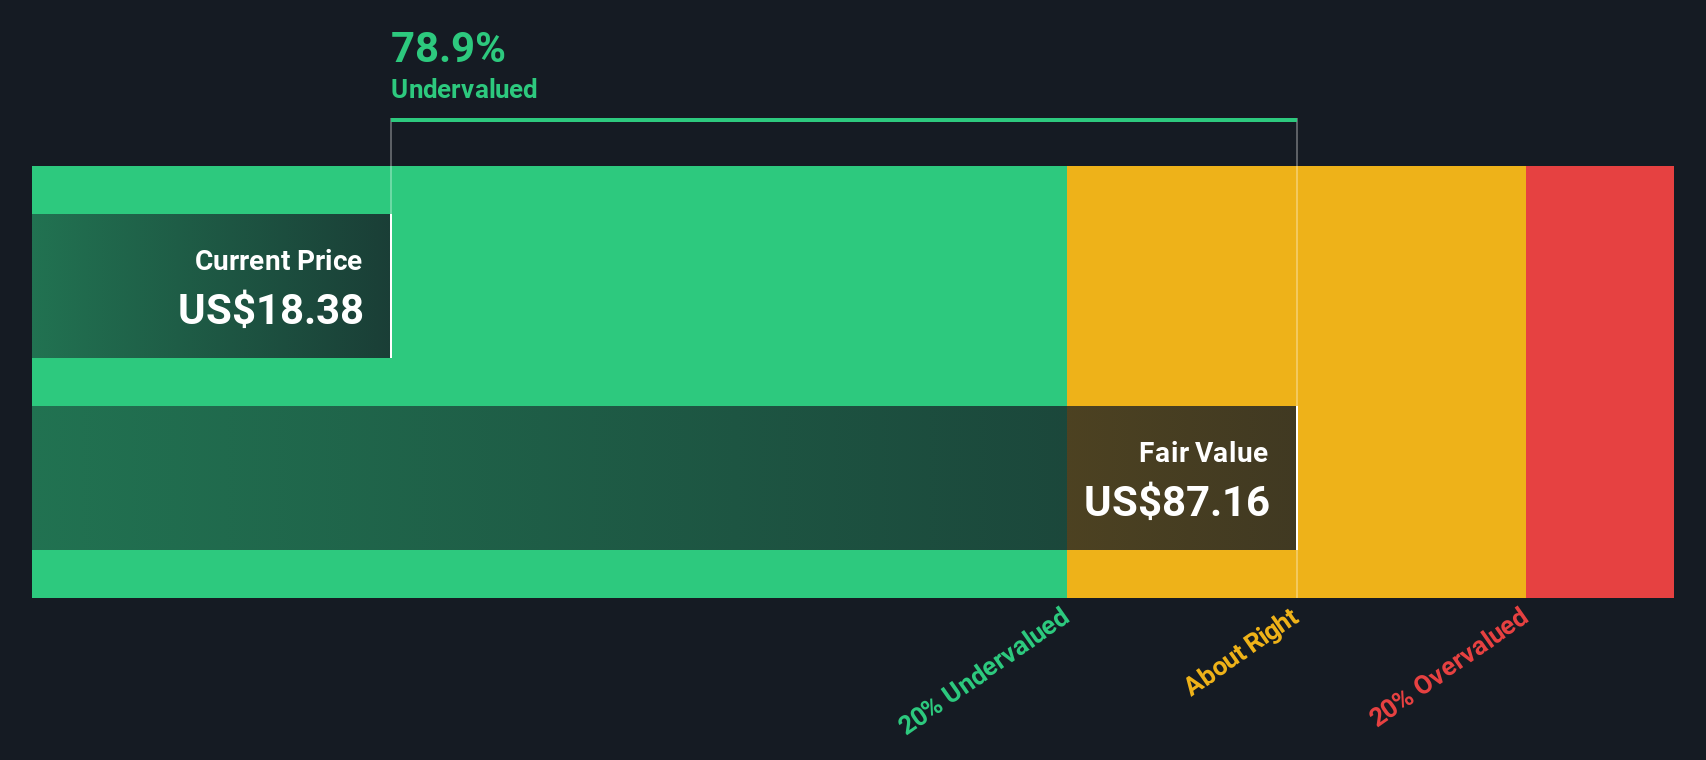
Putting all those discounted cash flows together gives an estimated intrinsic value of about $70.03 per share. Compared with the recent share price of $32.47, the model suggests the stock trades at a 53.6% discount to this estimate. On this DCF view alone, the analysis classifies Teva as materially undervalued.
Result: UNDERVALUED
Our Discounted Cash Flow (DCF) analysis suggests Teva Pharmaceutical Industries is undervalued by 53.6%. Track this in your watchlist or portfolio, or discover 886 more undervalued stocks based on cash flows.
Approach 2: Teva Pharmaceutical Industries Price vs Earnings
For a profitable business like Teva Pharmaceutical Industries, the P/E ratio is a straightforward way to see what investors are currently paying for each dollar of earnings. It reflects not only the earnings today, but also what the market expects in terms of future growth and how much risk investors see in those earnings.
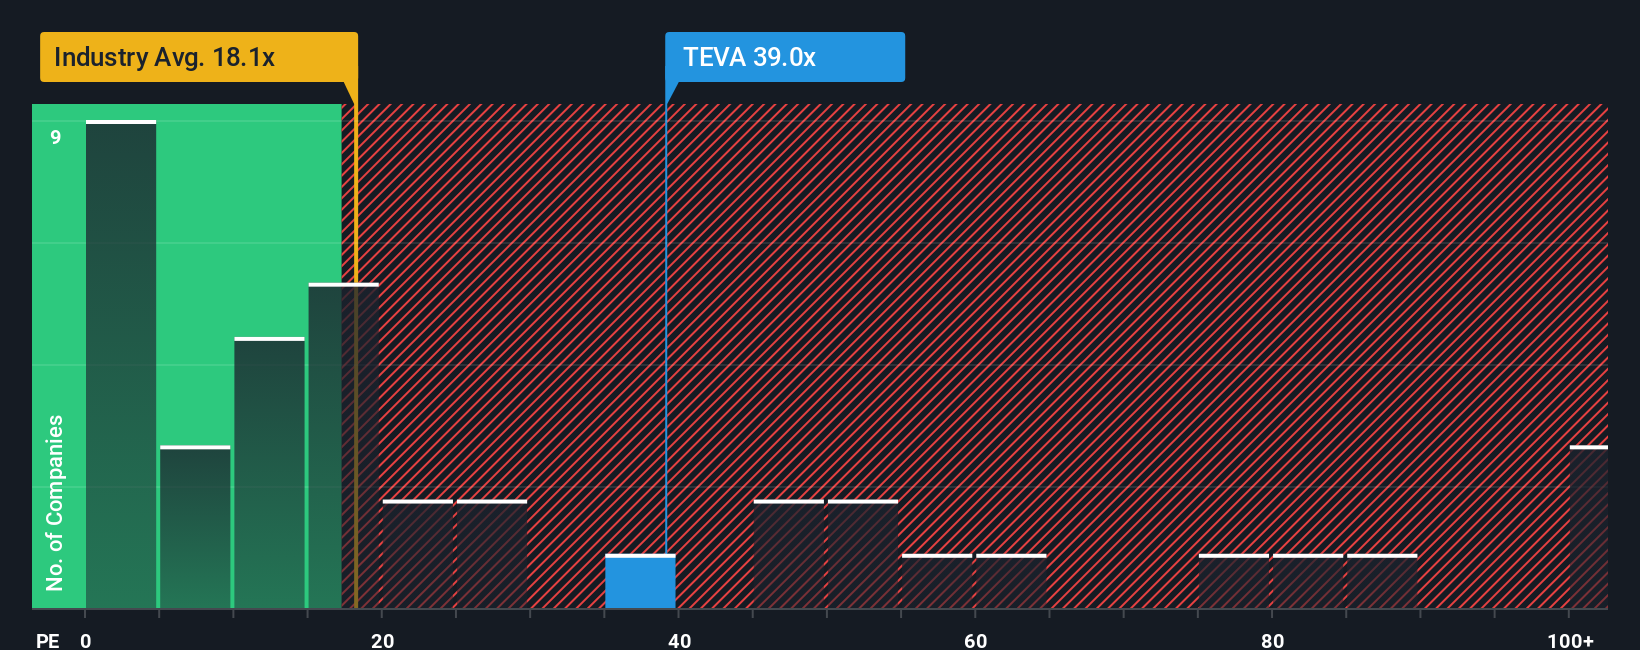
Higher growth expectations and lower perceived risk usually support a higher P/E, while slower expected growth or higher risk tend to justify a lower multiple. Teva currently trades on a P/E of 52.25x. That sits above the Pharmaceuticals industry average of 20.49x and above the peer group average of 19.18x, which indicates the market is pricing Teva at a premium to many listed drug makers.
Simply Wall St’s Fair Ratio for Teva is 25.49x. This is a proprietary estimate of what a more appropriate P/E might be, given factors such as the company’s earnings growth profile, industry, profit margins, market capitalization and specific risks. Because it blends these company specific inputs, the Fair Ratio can be more informative than a simple comparison with peers or the broad industry average. On this basis, Teva’s current P/E of 52.25x is above the Fair Ratio, which suggests the shares are screening as overvalued on earnings.
Result: OVERVALUED
P/E ratios tell one story, but what if the real opportunity lies elsewhere? Discover 1442 companies where insiders are betting big on explosive growth.
Upgrade Your Decision Making: Choose your Teva Pharmaceutical Industries Narrative
Earlier we mentioned that there is an even better way to understand valuation. On Simply Wall St’s Community page you can use Narratives, where you or other investors set out a clear story for Teva Pharmaceutical Industries, link that story to specific forecasts for revenue, earnings and margins, translate those into a Fair Value, then compare that Fair Value with the current share price to guide buy or sell decisions. The Narrative keeps updating as new news or earnings arrive. For example, one Teva Narrative might lean toward the higher analyst price target of US$29.00 with stronger confidence in branded drugs and biosimilars. Another might anchor closer to US$18.00 with a focus on risks like debt, generics pressure and pricing. Both Narratives live side by side so you can see how different viewpoints map into different valuations in real time.
Do you think there's more to the story for Teva Pharmaceutical Industries? Head over to our Community to see what others are saying!
This article by Simply Wall St is general in nature. We provide commentary based on historical data and analyst forecasts only using an unbiased methodology and our articles are not intended to be financial advice. It does not constitute a recommendation to buy or sell any stock, and does not take account of your objectives, or your financial situation. We aim to bring you long-term focused analysis driven by fundamental data. Note that our analysis may not factor in the latest price-sensitive company announcements or qualitative material. Simply Wall St has no position in any stocks mentioned.