Is There an Opportunity in Amplitude After Recent Product Updates and Stock Momentum?
Amplitude Inc Class A AMPL | 6.83 | +0.59% |
- If you have ever wondered whether Amplitude stock is a hidden bargain or just another tech name, you are in the right place.
- While the stock edged up 0.8% over the past week and gained 3.9% in the last month, it is still down 5.4% year-to-date. This hints at a market that is cautiously optimistic but far from convinced.
- Recent headlines highlight a surge in interest across the analytics and product optimization space, with investors watching closely as Amplitude rolls out product updates and partners with industry players. These moves have helped counter earlier negative sentiment and inject some much-needed momentum into the stock.
- According to our analysis, Amplitude scores a 5 out of 6 on our valuation checks, suggesting the company could be trading at an attractive price. In the sections ahead, we will break down how valuation experts assess stocks like Amplitude, but stick around for an even more insightful way to look at value that most investors overlook.
Approach 1: Amplitude Discounted Cash Flow (DCF) Analysis
A Discounted Cash Flow (DCF) model estimates a company's value by projecting its future cash flows and then discounting those amounts back to today to find their present value. This approach allows investors to weigh what the business could realistically generate in cash, rather than relying solely on short-term metrics.
For Amplitude, analysts estimate the company's Free Cash Flow (FCF) at $14.3 Million as of the last twelve months. According to current projections, FCF is expected to grow each year, reaching $23 Million in 2026, $26 Million in 2027, $35 Million in 2028, and $107 Million by 2029. After 2029, additional projections based on industry assumptions see potential for continued growth, though investor confidence generally leans more heavily on the next five years. This near-term period is most scrutinized.
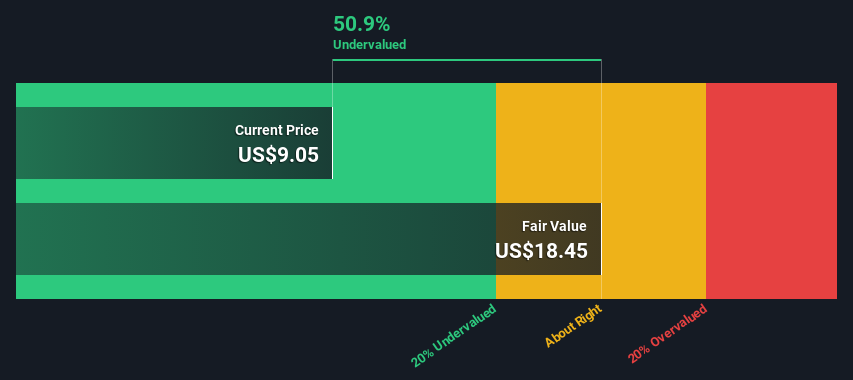
The DCF analysis assigns an estimated intrinsic value for Amplitude of $34.84 per share. Compared to the stock's current trading price, this suggests the shares could be trading at around a 71 percent discount to their true worth, marking them as significantly undervalued at present.
Result: UNDERVALUED
Our Discounted Cash Flow (DCF) analysis suggests Amplitude is undervalued by 71.0%. Track this in your watchlist or portfolio, or discover 927 more undervalued stocks based on cash flows.
Approach 2: Amplitude Price vs Sales
For companies like Amplitude that have yet to achieve consistent profitability, the Price-to-Sales (P/S) ratio is a preferred valuation metric. This multiple is particularly relevant for high-growth software firms, as it compares a company’s market value to its revenues rather than its earnings, which can fluctuate or be negative during investment-heavy growth phases.
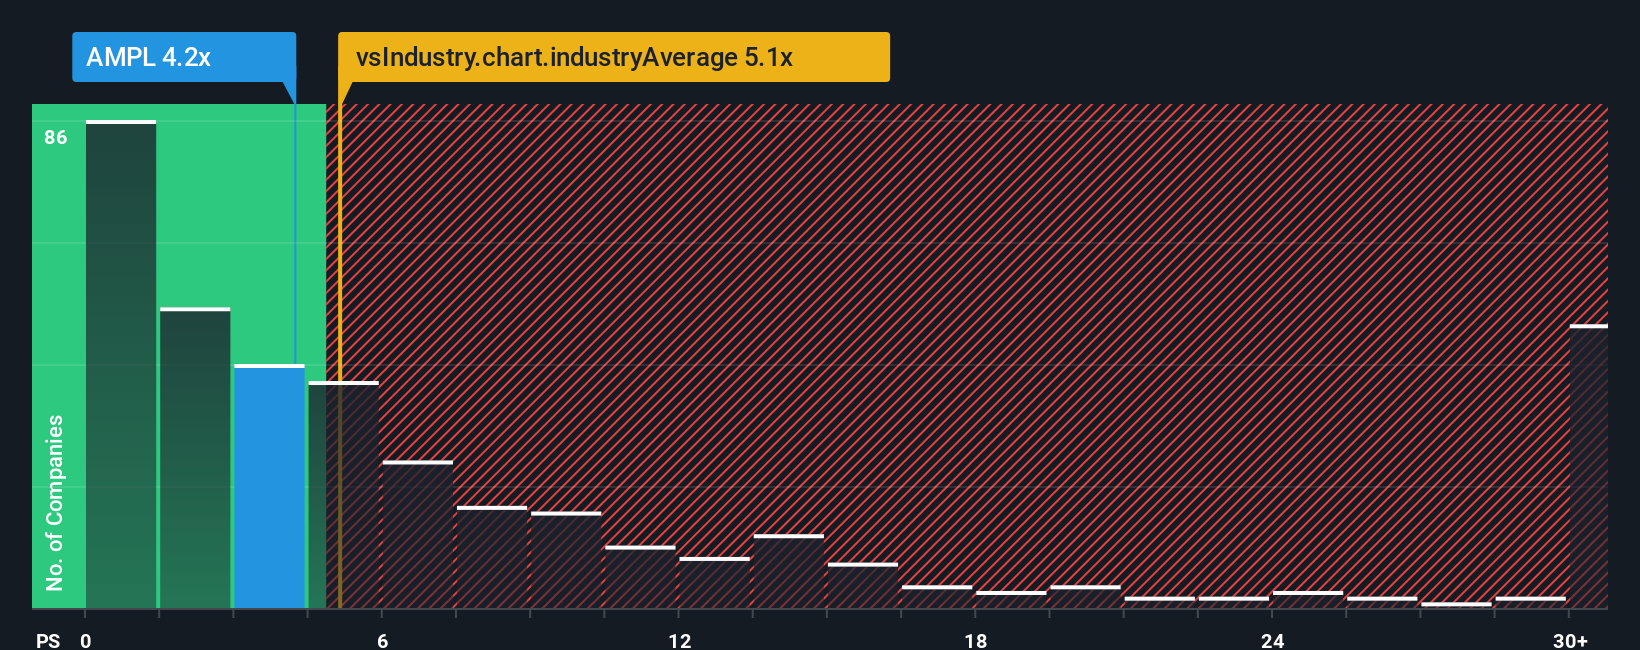
The "right" P/S ratio for a business depends on growth expectations and perceived risk. Higher ratios can be justified for companies showing rapid revenue expansion and strong future prospects. Elevated business risks or slowing growth usually warrant a lower multiple. In the software industry, where scalable growth is highly valued, Amplitude’s current P/S ratio is 4.1x. This stands just below the sector average of 4.74x and slightly above its peer group at 2.86x.
Simply Wall St's proprietary "Fair Ratio" for Amplitude is 4.40x. Unlike simple peer and industry comparisons, the Fair Ratio factors in a deeper analysis of Amplitude’s projected growth, risk profile, profit margins, market capitalization, and sector trends. This leads to a more nuanced measure of what investors should be willing to pay for each dollar of sales given the company’s unique characteristics.
At a current P/S ratio of 4.1x, Amplitude is trading just below its calculated Fair Ratio. With the difference between the actual and fair multiples being less than 0.10, this suggests the stock is valued about right given its current outlook and risks.
Result: ABOUT RIGHT
PS ratios tell one story, but what if the real opportunity lies elsewhere? Discover 1439 companies where insiders are betting big on explosive growth.
Upgrade Your Decision Making: Choose your Amplitude Narrative
Earlier we mentioned that there is an even better way to understand valuation, so let us introduce you to Narratives. A Narrative is your chance to lay out your own story for a company, translating your perspective and expectations, including assumed fair value, future revenue, and margin forecasts, into a single, clear investment case. Narratives connect the dots between what you believe about Amplitude’s future, the financial forecasts you expect, and the fair value you would assign based on those assumptions.
On Simply Wall St’s Community page, millions of users are already leveraging Narratives to cut through the noise and anchor their decisions with facts and logic, not just gut feeling. Narratives make investing more approachable by allowing you to directly compare your Fair Value with the current share price, helping you decide if it makes sense to buy, hold, or sell. As new information such as earnings announcements or sector news emerges, your narrative is automatically updated for you, so your view stays fresh and relevant.
For Amplitude, some investors are optimistic, forecasting runway growth and setting fair values near $18.00, while others are more cautious, targeting $13.00 to reflect risks. Narratives reveal and help you compare these different viewpoints in a transparent and dynamic way.
Do you think there's more to the story for Amplitude? Head over to our Community to see what others are saying!

This article by Simply Wall St is general in nature. We provide commentary based on historical data and analyst forecasts only using an unbiased methodology and our articles are not intended to be financial advice. It does not constitute a recommendation to buy or sell any stock, and does not take account of your objectives, or your financial situation. We aim to bring you long-term focused analysis driven by fundamental data. Note that our analysis may not factor in the latest price-sensitive company announcements or qualitative material. Simply Wall St has no position in any stocks mentioned.