Is There Still Opportunity in Lennar After 28% Drop Ahead of 2025 Earnings?
Lennar Corporation Class A LEN | 85.44 85.44 | -1.61% 0.00% Pre |
If you are sizing up Lennar’s stock right now, you are probably weighing that classic dilemma: is this the right entry point or has the ride already happened? Over the past three years, Lennar has delivered a remarkable 91.4% return, firmly outperforming the broader housing sector and leaving long-term investors with plenty to smile about. Yet, recent performance might give you pause. The stock closed last at $122.44, up a steady 1.9% over the last week but down 8.5% in the past month and almost 9% year-to-date. Zoom out over twelve months and you will see a noticeable decline of 28.5%, which is a real head-scratcher if you have been tracking the company’s growth story.
Some of these moves are tied to broader market sentiment around homebuilders, mixed economic signals, and shifting perceptions of risk as mortgage rates and housing demand send conflicting signals. Despite a long-term bullish run, short-term pullbacks suggest the market is actively reassessing Lennar’s outlook and risk profile.
Many investors are now zeroing in on valuation. Using a six-point valuation check system, Lennar only gets a score of 1 out of 6 for being undervalued. This is hardly a screaming bargain, though not necessarily overpriced. But what does that score really tell us about Lennar’s stock at today’s price? Next, we will dig into the valuation methods behind that number, and, as always, we will explore an even smarter way to understand if Lennar is truly a value play right now.
Lennar scores just 1/6 on our valuation checks. See what other red flags we found in the full valuation breakdown.
Approach 1: Lennar Discounted Cash Flow (DCF) Analysis
The Discounted Cash Flow (DCF) model is a classic way to estimate a company's intrinsic value by projecting its future free cash flows and discounting them back to today's dollars. This method aims to answer one core question: what is the business really worth if you owned all its future cash generation?
For Lennar, current Free Cash Flow (FCF) stands at -$702.5 Million, meaning the business recently spent more cash than it generated. Analysts forecast a rebound, with FCF projected to rise to about $2.15 Billion by 2026. Over the next decade, Simply Wall St extrapolates these trends, showing FCF fluctuating but remaining above $1 Billion annually. The discounted value peaks around $1.98 Billion in 2026 and then moderates gradually in later years.
Based on these cash flow projections, the DCF model calculates an estimated fair value of Lennar's shares at $81.55. With the current share price at $122.44, this suggests Lennar is trading at a 50.1% premium to its intrinsic value. This implies the market is highly optimistic or the stock is significantly overvalued by this measure.
Result: OVERVALUED
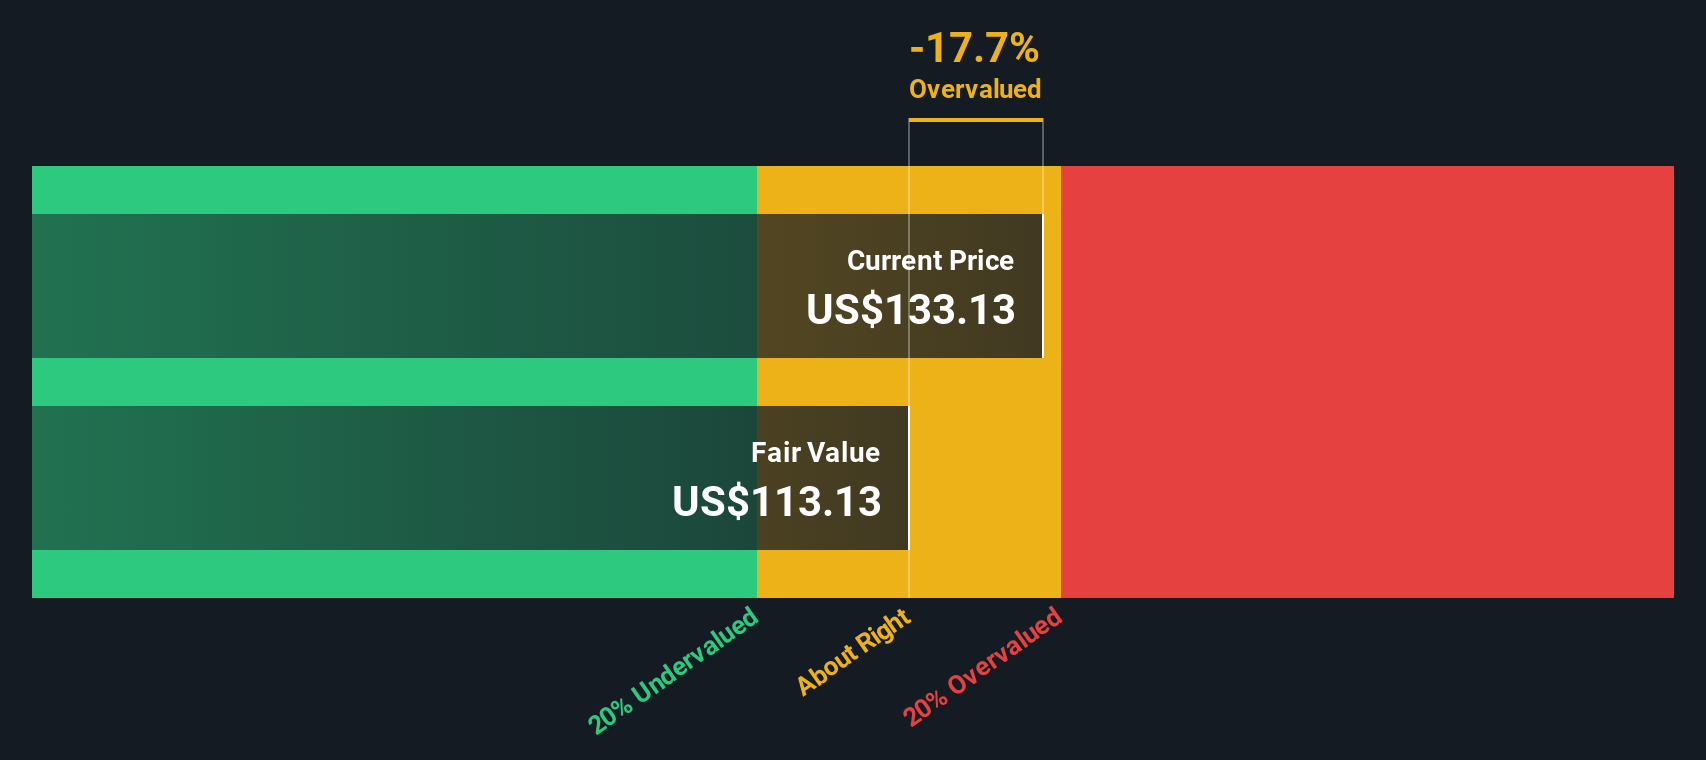
Our Discounted Cash Flow (DCF) analysis suggests Lennar may be overvalued by 50.1%. Find undervalued stocks or create your own screener to find better value opportunities.
Approach 2: Lennar Price vs Earnings
The Price-to-Earnings (PE) ratio is a popular metric for valuing profitable companies like Lennar. It tells investors how much they are paying for each dollar of the company’s earnings, making it a straightforward way to gauge whether a stock is expensive or reasonably priced based on its profits. For established businesses with steady earnings, the PE ratio is especially meaningful.
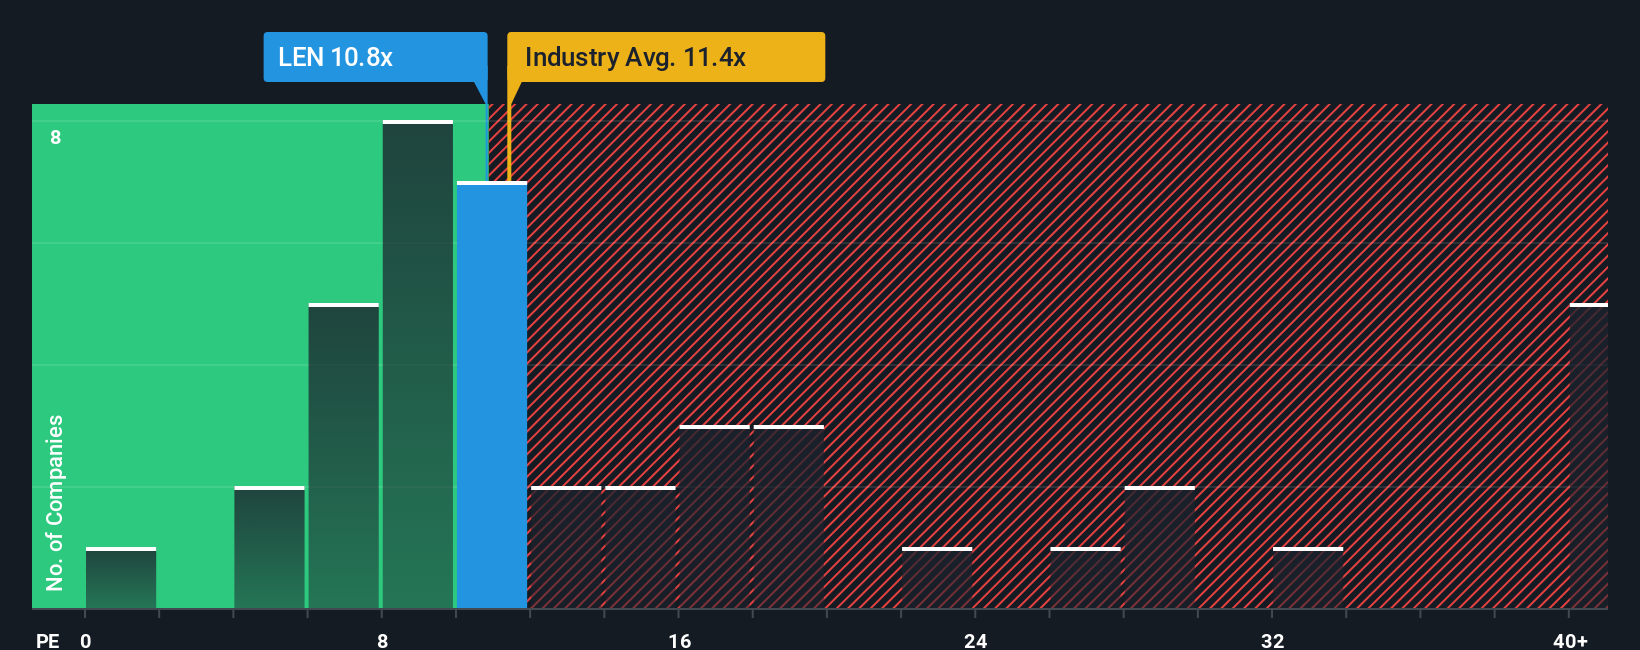
Growth expectations and risk are key in determining what a “normal” or “fair” PE ratio should look like. Rapidly growing companies or those with fewer risks typically warrant higher PE ratios, while slower-growing or riskier companies tend to see lower multiples. For Lennar, the current PE ratio sits at 11.75x, just above both the industry average of 10.71x and the peer group average of 11.13x. This puts Lennar in line with what the market pays for similar businesses in its space.
Simply Wall St’s “Fair Ratio” introduces another layer to the analysis. Unlike simple peer or industry comparisons, it incorporates a wider set of variables, including Lennar’s earnings growth, market cap, profit margins, and risk. Lennar’s Fair Ratio is calculated at 16.72x, notably higher than its current PE. This means that accounting for all these factors, the stock could reasonably support a higher multiple than what it currently trades at. Because Lennar’s actual PE ratio is meaningfully below its Fair Ratio, the fair value signals that Lennar is undervalued by this measure.
Result: UNDERVALUED
PE ratios tell one story, but what if the real opportunity lies elsewhere? Discover companies where insiders are betting big on explosive growth.
Upgrade Your Decision Making: Choose Your Lennar Narrative
Earlier we mentioned that there is an even better way to understand valuation, so let us introduce you to Narratives. A Narrative connects your view of Lennar’s story, such as why revenues and margins might rise or fall, to your own forecasts and an estimated fair value. This gives real context to the numbers behind the stock.
Unlike static analysis, Narratives let you express your investment thesis and see the impact of your expectations in real time. This tool, available to all users on the Simply Wall St Community page, makes it easy to map out assumptions, adjust forecasts, and compare your Fair Value directly to the current share price to help inform your decision regarding Lennar.
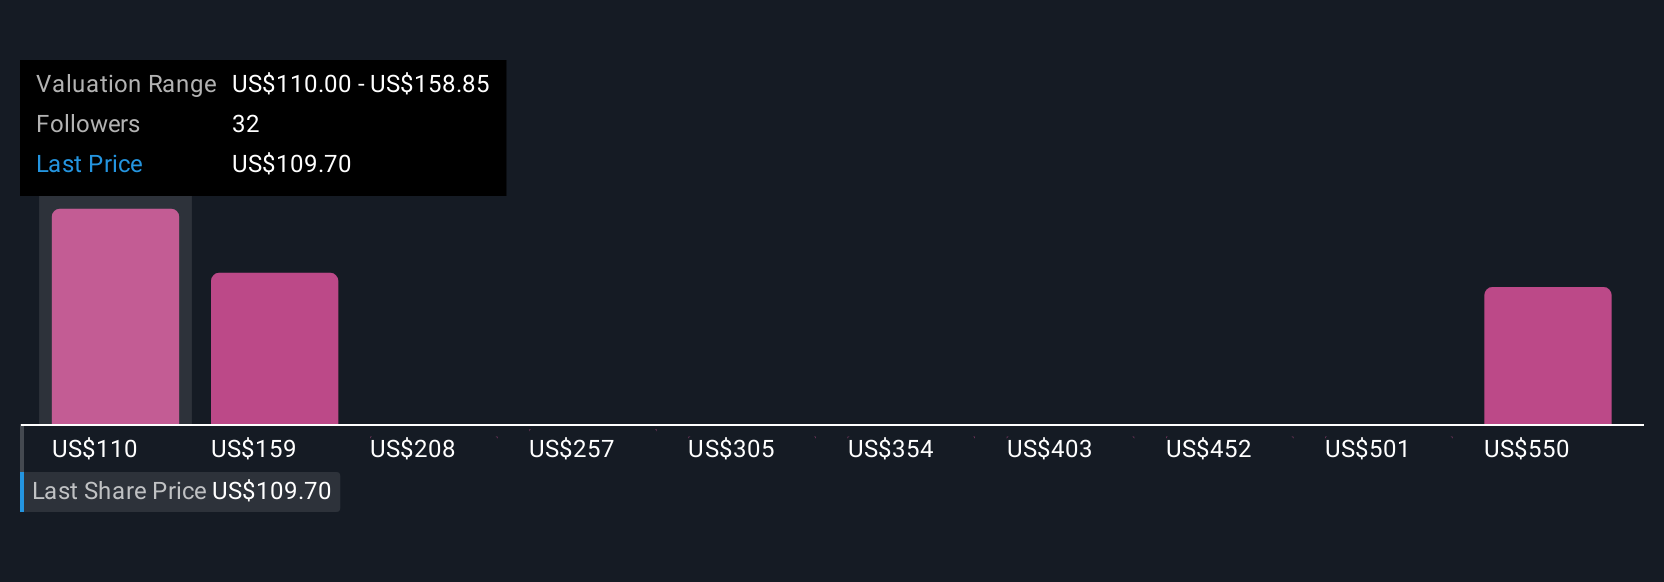
Narratives are dynamic. They update as the business releases financials, as news breaks, and as other investors share fresh insights. This means your valuation is always grounded in the latest information. For example, while some Lennar Narratives suggest a bullish fair value near $162 based on higher margin recovery and demand rebound, others adopt a more cautious outlook, indicating a fair value closer to $95 if margins and growth disappoint. This demonstrates how Narratives reveal the real debate behind every stock price.
Do you think there's more to the story for Lennar? Create your own Narrative to let the Community know!
This article by Simply Wall St is general in nature. We provide commentary based on historical data and analyst forecasts only using an unbiased methodology and our articles are not intended to be financial advice. It does not constitute a recommendation to buy or sell any stock, and does not take account of your objectives, or your financial situation. We aim to bring you long-term focused analysis driven by fundamental data. Note that our analysis may not factor in the latest price-sensitive company announcements or qualitative material. Simply Wall St has no position in any stocks mentioned.