Is There Still Value In Bank Of America (BAC) After Recent Rate And Regulation Debates
Bank of America Corp BAC | 49.38 | +0.22% |
- This piece is designed to help you assess for yourself whether Bank of America stock still offers value at today's price, or if most of the opportunity is already priced in.
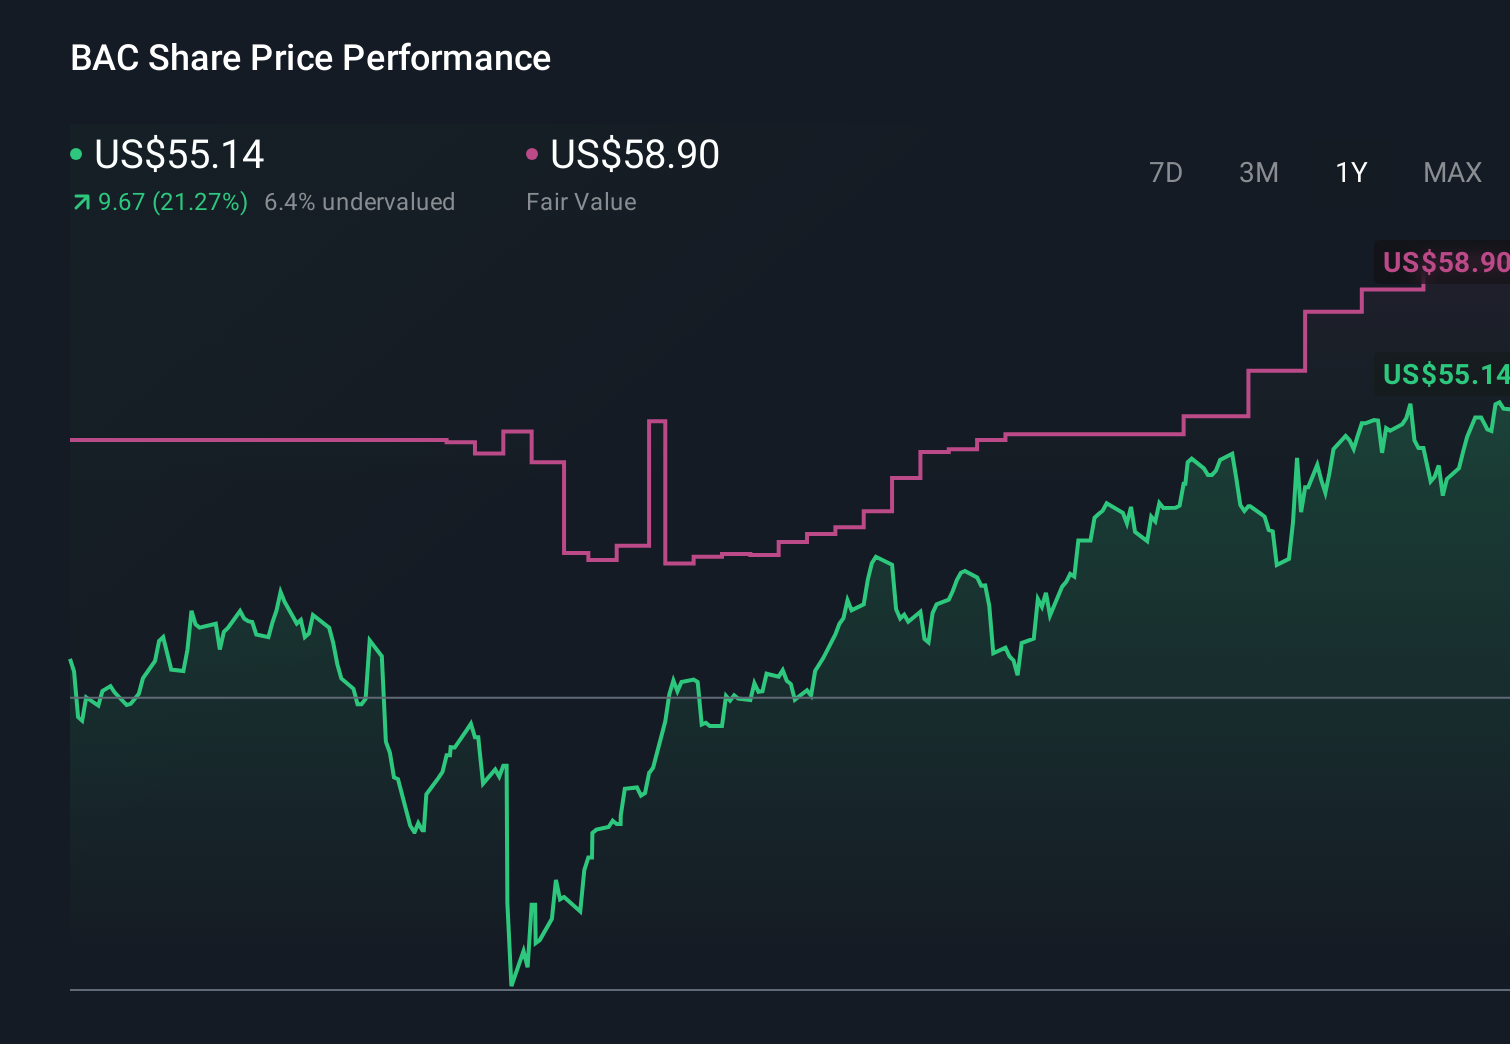
- Bank of America shares last closed at US$51.72, with returns of a 2.4% decline over 7 days, an 8.1% decline over 30 days, a 7.6% decline year to date, and a 13.8% gain over 1 year, 57.8% over 3 years, and 96.8% over 5 years.
- Recent headlines have focused on Bank of America as one of the major US banks at the center of discussions about interest rate trends and credit conditions. This helps frame how investors are thinking about the stock. There has also been ongoing coverage of large US banks in regulatory and capital requirement debates, giving extra context to recent share price moves.
- On Simply Wall St's valuation checks, Bank of America scores 4 out of 6, as shown in its valuation score. Next we will break down what that means across different methods before finishing with a more holistic way to think about value.
Approach 1: Bank of America Excess Returns Analysis
The Excess Returns model looks at how much profit a company is expected to generate over and above the return required by its shareholders, then converts that stream of excess profit into a per share value today.
For Bank of America, the model starts with a Book Value of $38.44 per share and a Stable EPS estimate of $5.02 per share, based on weighted future Return on Equity estimates from 13 analysts. The Average Return on Equity used in the model is 11.78%, with a Stable Book Value of $42.60 per share, based on weighted future Book Value estimates from 14 analysts.
The required return for shareholders, or Cost of Equity, is set at $3.88 per share. That implies an Excess Return of $1.14 per share, which is the yearly profit above the model’s required return that is attributed to each share.
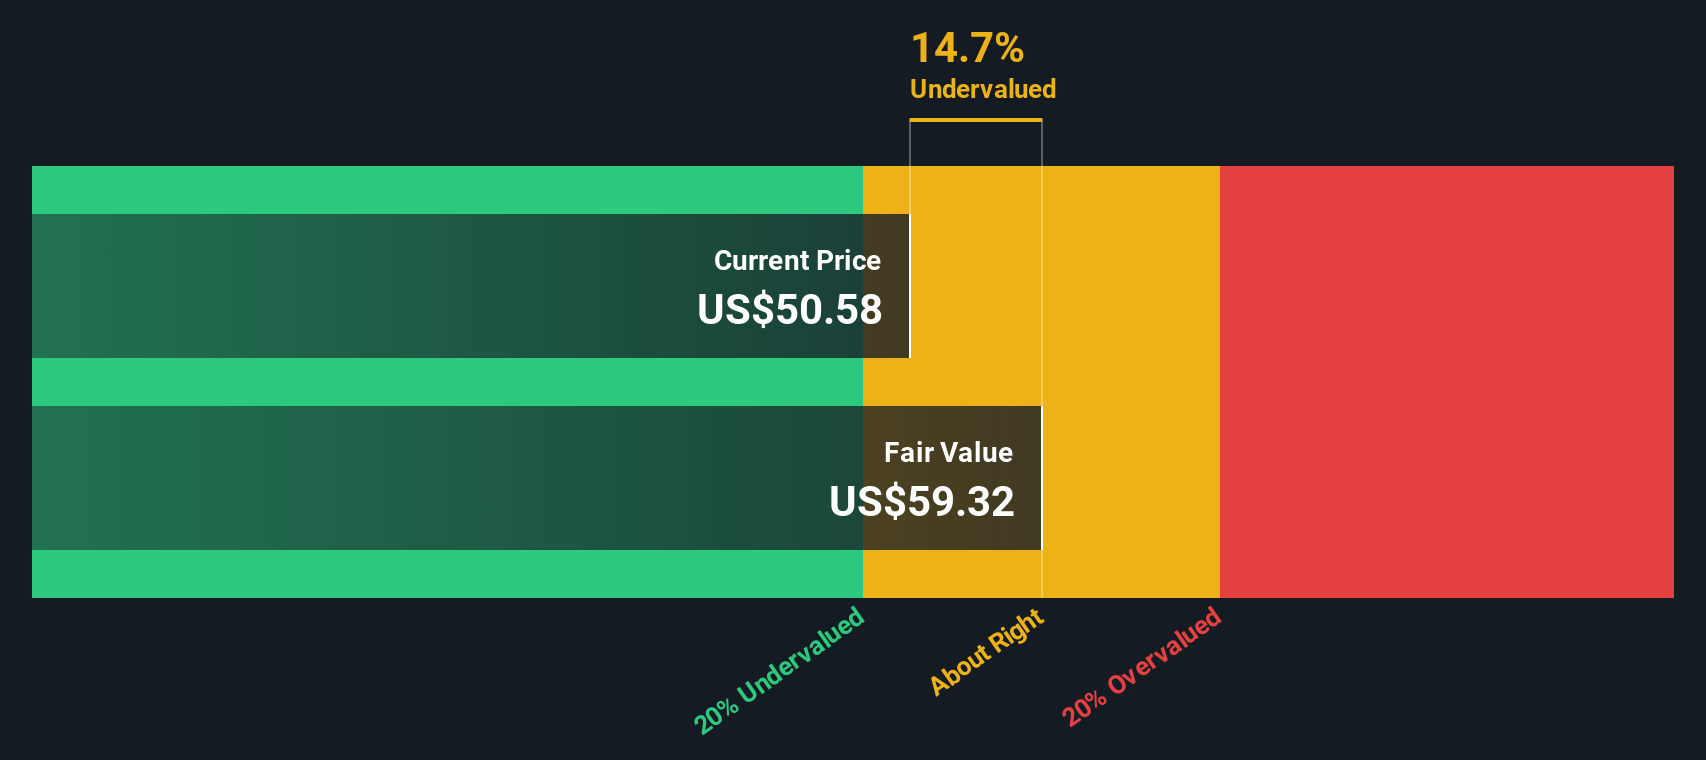
When Simply Wall St capitalizes these excess returns, it arrives at an intrinsic value of about $62.04 per share, implying the stock is around 16.6% undervalued versus the recent price of $51.72.
Result: UNDERVALUED
Our Excess Returns analysis suggests Bank of America is undervalued by 16.6%. Track this in your watchlist or portfolio, or discover 864 more undervalued stocks based on cash flows.
Approach 2: Bank of America Price vs Earnings
For a consistently profitable bank, the P/E ratio is a straightforward way to think about value because it links what you pay for each share to the earnings that the business is already generating.
In general, higher growth expectations or lower perceived risk tend to support a higher P/E ratio, while slower expected growth or higher risk usually line up with a lower, more conservative multiple. That context matters when you compare any stock with its sector or the broader market.
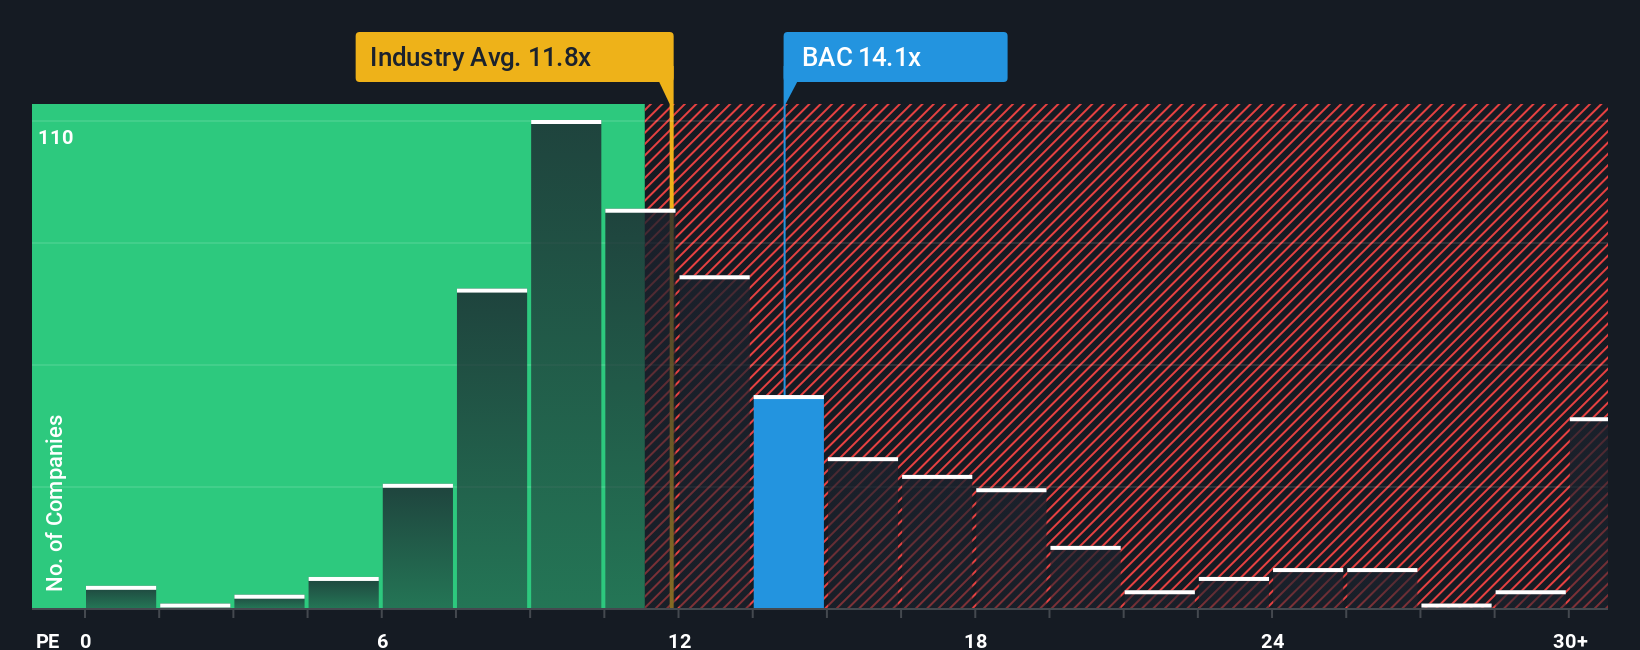
Bank of America currently trades on a P/E of 12.84x. That sits above the Banks industry average P/E of 11.81x and slightly below the peer group average of 13.73x. Simply Wall St’s “Fair Ratio” for Bank of America is 16.67x, which is their view of a suitable P/E once factors such as earnings growth, industry, profit margins, market cap and company specific risks are taken into account.
This Fair Ratio can be more useful than a simple peer or industry comparison because it adjusts for the company’s own profile rather than assuming all banks deserve the same multiple. With the Fair Ratio of 16.67x sitting above the current 12.84x P/E, the model points to Bank of America trading below that fair level.
Result: UNDERVALUED
P/E ratios tell one story, but what if the real opportunity lies elsewhere? Discover 1428 companies where insiders are betting big on explosive growth.
Upgrade Your Decision Making: Choose Your Bank of America Narrative
Earlier we mentioned that there is an even better way to understand valuation. Let us introduce you to Narratives, which are simply your story about a company, linked directly to the numbers you think are realistic for its fair value, future revenue, earnings and margins.
On Simply Wall St’s Community page, you can select or build a Narrative for Bank of America that connects what you believe about the bank’s business, regulation and interest rate exposure to a forecast, and then to a Fair Value that you can compare with today’s price to decide whether the stock looks attractive or expensive to you.
Narratives are easy to use because the platform translates your assumptions into a full financial model and keeps that view updated when new earnings, news or estimates are added. Your Fair Value view can therefore adjust as the facts change rather than staying fixed.
For Bank of America, one investor might pick a Narrative with relatively cautious revenue and margin assumptions and a lower Fair Value than the current price, while another might choose a Narrative with higher growth and profitability expectations and a Fair Value that sits well above where the stock trades today.
Do you think there's more to the story for Bank of America? Head over to our Community to see what others are saying!
This article by Simply Wall St is general in nature. We provide commentary based on historical data and analyst forecasts only using an unbiased methodology and our articles are not intended to be financial advice. It does not constitute a recommendation to buy or sell any stock, and does not take account of your objectives, or your financial situation. We aim to bring you long-term focused analysis driven by fundamental data. Note that our analysis may not factor in the latest price-sensitive company announcements or qualitative material. Simply Wall St has no position in any stocks mentioned.