Is Tractor Supply (TSCO) Pricing Make Sense After Mixed Multi Year Share Performance
Tractor Supply Company TSCO | 44.63 | -0.27% |
- Investors may be wondering whether Tractor Supply's current share price aligns with its fundamentals, or if the market is overlooking something in plain sight.
- The stock most recently closed at US$54.05, with returns of 1.1% over the last 7 days, 4.9% over 30 days, 6.3% year to date, roughly flat over 1 year, 19.7% over 3 years and 81.1% over 5 years. Taken together, these figures provide a mixed picture of recent momentum and longer-term performance.
- Recent attention around Tractor Supply has focused on its position as a rural lifestyle retailer and how its store footprint and product mix appeal to a broad base of everyday customers. That context helps frame how investors are reacting to the stock today, even without a major single headline driving the latest moves.
- On our checklist of 6 valuation tests, Tractor Supply scores 1 out of 6. Below, we break down what different valuation methods indicate about that score, and then finish with an approach to assessing value that can give you a fuller picture than any single metric.
Tractor Supply scores just 1/6 on our valuation checks. See what other red flags we found in the full valuation breakdown.
Approach 1: Tractor Supply Discounted Cash Flow (DCF) Analysis
A Discounted Cash Flow, or DCF, model takes estimates of a company’s future cash flows and discounts them back to today using a required rate of return. The goal is to estimate what those future dollars are worth in today’s terms.
For Tractor Supply, the model uses a 2 Stage Free Cash Flow to Equity approach based on cash flow projections. The latest twelve month free cash flow is about $794.5 million. Analyst forecasts and subsequent extrapolations point to free cash flow rising to around $1,380.8 million in 2035, with interim years such as 2026 and 2028 projected at $944.6 million and $1,098.0 million respectively. These later year figures beyond the initial analyst horizon are extrapolated by Simply Wall St.
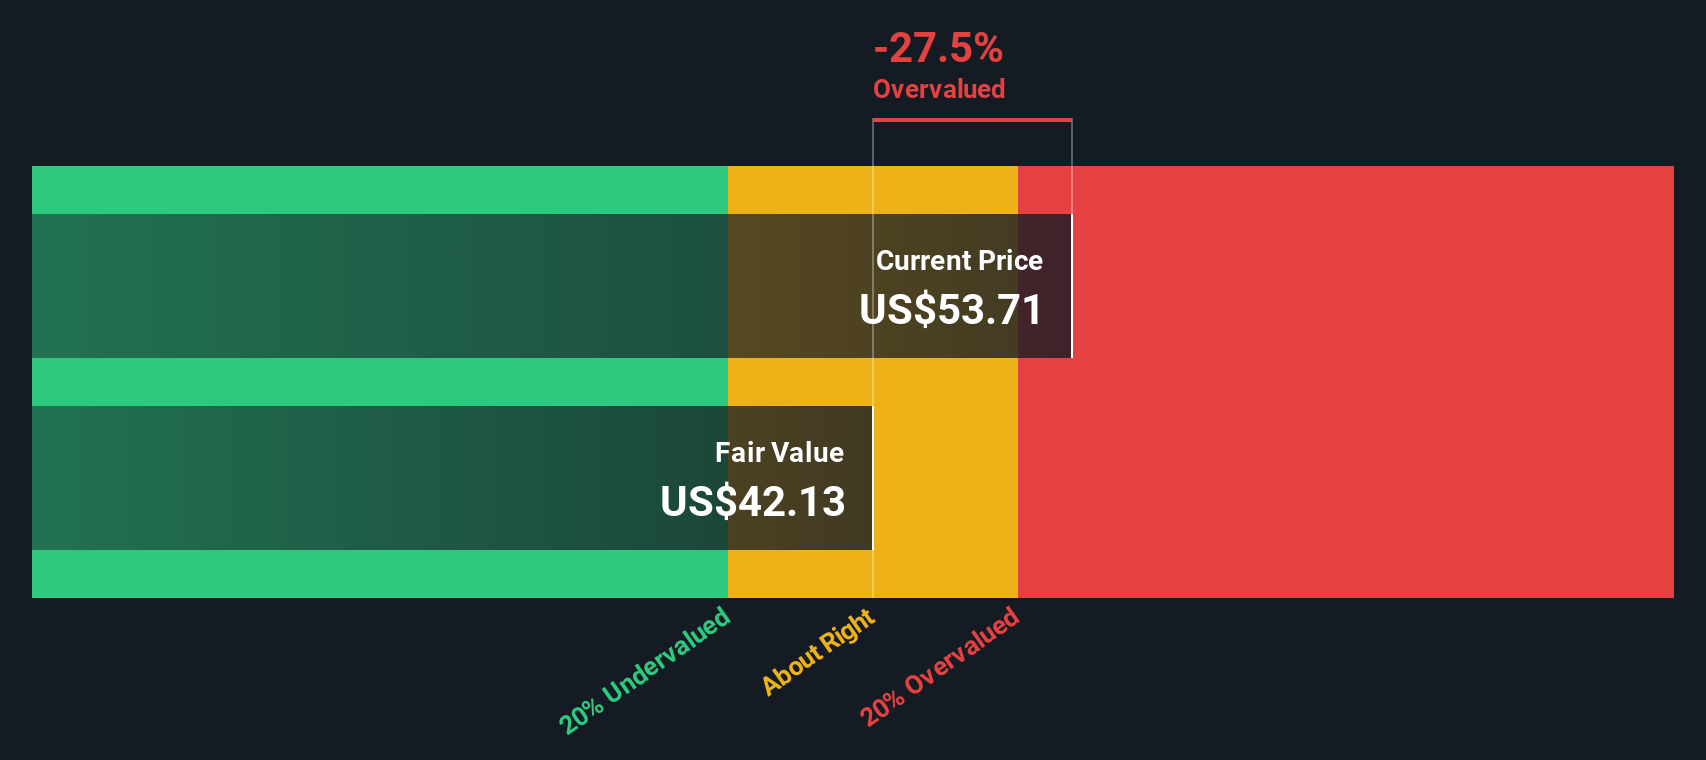
Bringing all those projected cash flows back to today, the DCF model suggests an intrinsic value of about $35.14 per share. Against the recent share price of roughly $54.05, this implies Tractor Supply is 53.8% overvalued on this measure.
Result: OVERVALUED
Our Discounted Cash Flow (DCF) analysis suggests Tractor Supply may be overvalued by 53.8%. Discover 51 high quality undervalued stocks or create your own screener to find better value opportunities.
Approach 2: Tractor Supply Price vs Earnings
For profitable businesses, the P/E ratio is a useful way to relate what you pay for each share to the earnings that company is currently generating. It gives you a quick sense of how many dollars of price the market is assigning to each dollar of earnings.
What counts as a “normal” P/E depends on how investors view growth potential and risk. Higher expected earnings growth or lower perceived risk can justify a higher P/E, while slower expected growth or higher perceived risk usually points to a lower one.
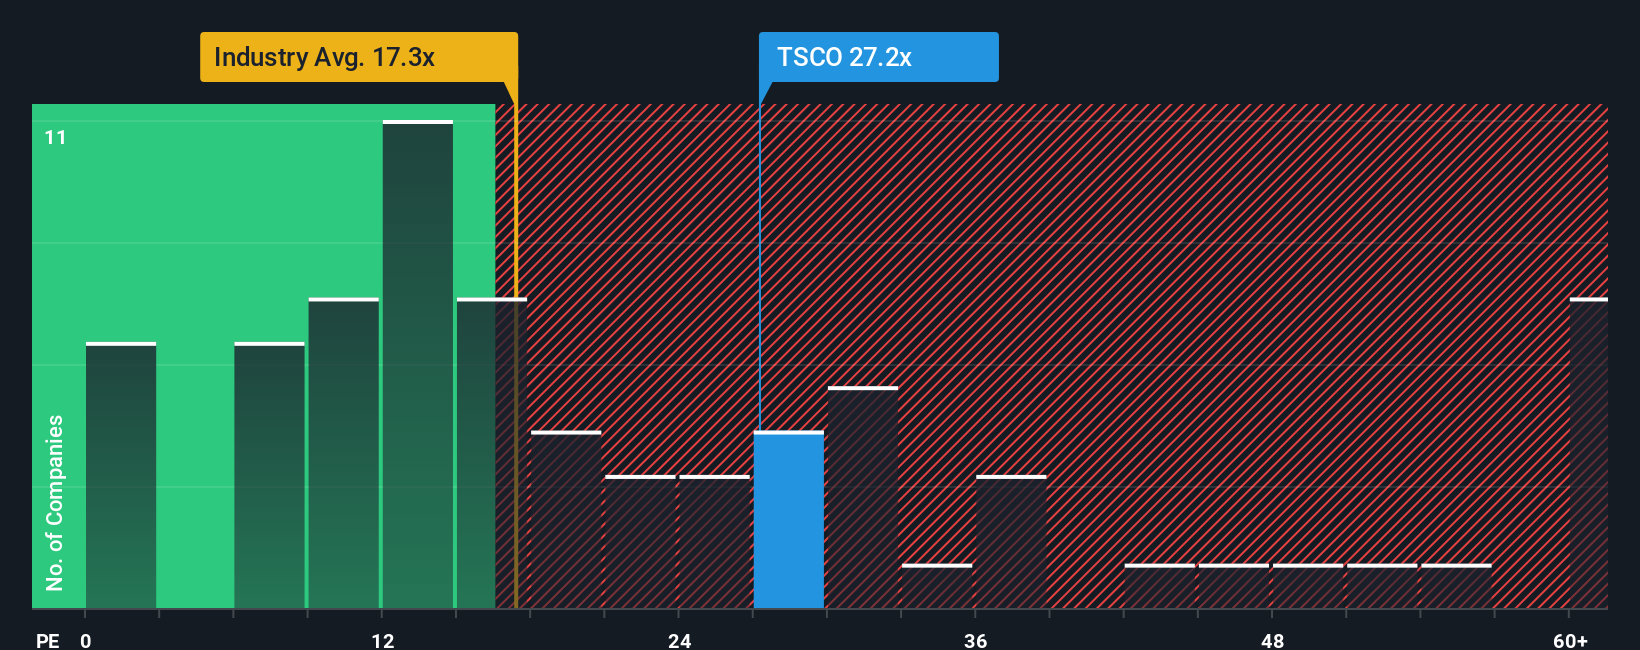
Tractor Supply currently trades on a P/E of about 26.1x. That sits above the Specialty Retail industry average of roughly 20.4x and below the peer group average of around 33.7x. Simply Wall St’s proprietary Fair Ratio for Tractor Supply is 18.5x. This Fair Ratio reflects factors such as the company’s earnings growth profile, profit margins, industry, market value and specific risks, which makes it more tailored than a simple comparison with broad industry or peer averages.
With the actual P/E of 26.1x sitting above the Fair Ratio of 18.5x, Tractor Supply screens as relatively expensive on this measure.
Result: OVERVALUED
P/E ratios tell one story, but what if the real opportunity lies elsewhere? Start investing in legacies, not executives. Discover our 23 top founder-led companies.
Upgrade Your Decision Making: Choose your Tractor Supply Narrative
Earlier we mentioned that there is an even better way to understand valuation. Narratives let you attach your own story about Tractor Supply to the numbers by linking your assumptions for future revenue, earnings and margins to a fair value, then comparing that fair value with today’s price. This all takes place within Simply Wall St’s Community page, where Narratives are updated when new information such as earnings or news arrives. For example, one investor might see Tractor Supply closer to US$70 based on expectations for supply chain diversification, PetRx integration and revenue growth, while another might anchor nearer US$47 because they focus more on tariff risks, legal issues and pressure on big ticket sales.
Do you think there's more to the story for Tractor Supply? Head over to our Community to see what others are saying!

This article by Simply Wall St is general in nature. We provide commentary based on historical data and analyst forecasts only using an unbiased methodology and our articles are not intended to be financial advice. It does not constitute a recommendation to buy or sell any stock, and does not take account of your objectives, or your financial situation. We aim to bring you long-term focused analysis driven by fundamental data. Note that our analysis may not factor in the latest price-sensitive company announcements or qualitative material. Simply Wall St has no position in any stocks mentioned.