Is Tradeweb Markets (TW) Pricing Look Stretched After Recent 20% One Year Share Decline
Tradeweb Markets TW | 123.20 | +3.91% |
- If you are looking at Tradeweb Markets and wondering whether the current share price offers good value, this article will walk through what the numbers actually say.
- The stock recently closed at US$103.82, with returns of a 2.2% decline over 7 days, a 2.8% decline over 30 days, a 2.2% decline year to date and a 20.5% decline over 1 year. The 3 year and 5 year returns sit at 46.7% and 63.9% respectively.
- These moves have put more attention on how Tradeweb is priced versus its fundamentals. Recent coverage has focused on how electronic trading platforms fit into investors' portfolios and how market structure trends influence interest in the stock. This backdrop helps explain why some investors are re-checking whether the recent share price better reflects the company's long term prospects and risk profile.
- Simply Wall St currently gives Tradeweb Markets a valuation score of 0 out of 6. We will walk through traditional valuation methods next, then finish by looking at a more holistic way to think about what the stock might be worth.
Tradeweb Markets scores just 0/6 on our valuation checks. See what other red flags we found in the full valuation breakdown.
Approach 1: Tradeweb Markets Excess Returns Analysis
The Excess Returns model looks at how much profit a company is expected to generate above the return that equity investors require, then capitalizes those “extra” earnings into an estimate of value per share.
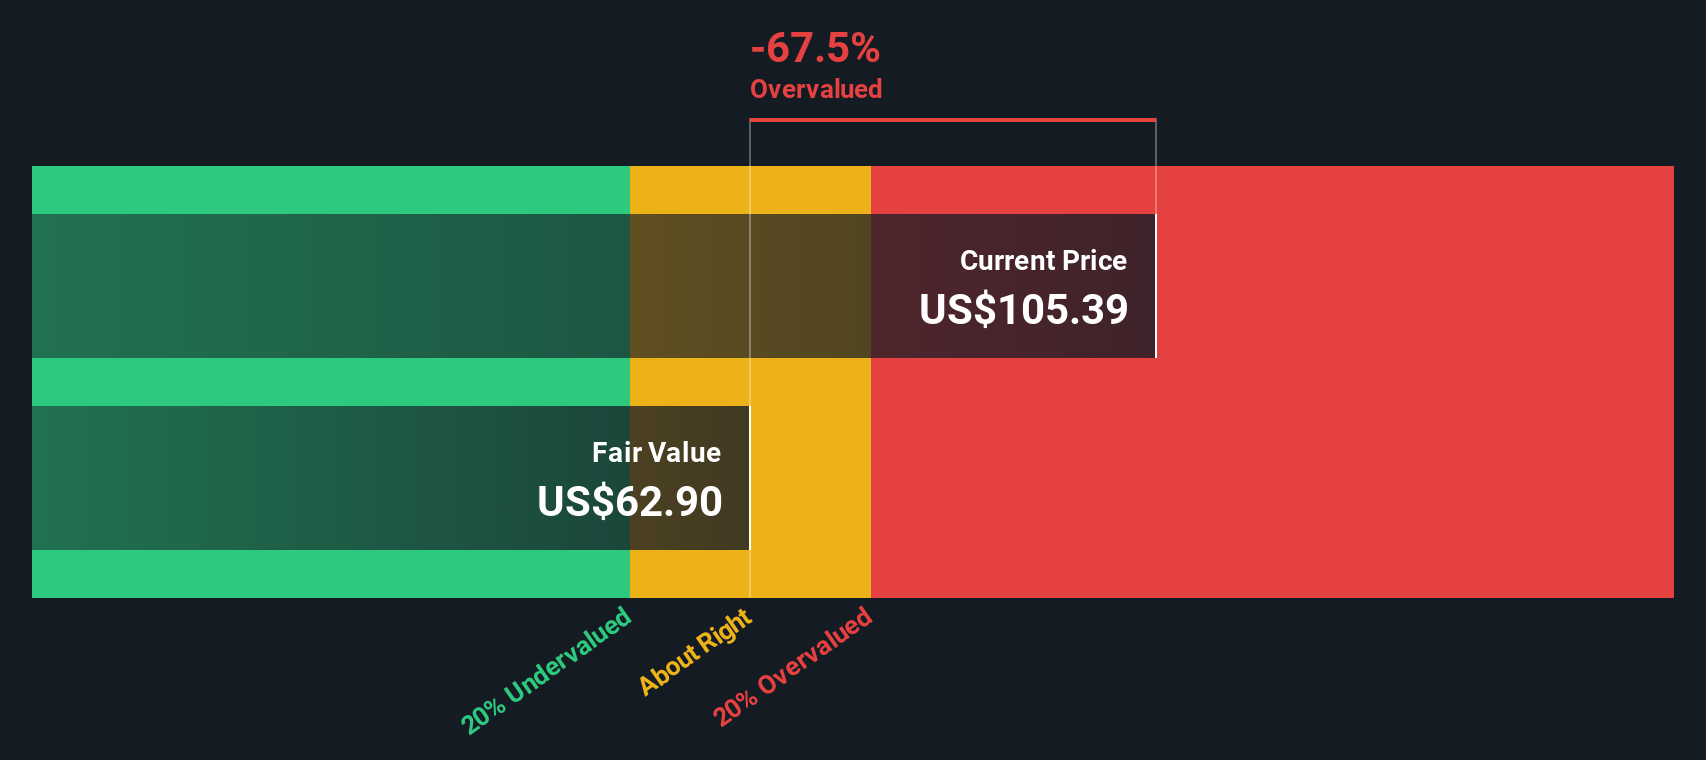
For Tradeweb Markets, the model starts with a Book Value of US$29.43 per share and a Stable EPS of US$4.35 per share, based on weighted future Return on Equity estimates from 4 analysts. The implied Cost of Equity is US$2.80 per share, so the Excess Return is US$1.55 per share. That excess is supported by an Average Return on Equity of 12.52% and a Stable Book Value estimate of US$34.77 per share, sourced from 3 analysts.
Simply Wall St converts these excess returns on the equity base into an intrinsic value of about US$67.01 per share using its Excess Returns Model. Compared with the recent share price of US$103.82, this framework suggests the stock is 54.9% overvalued on this metric alone.
Result: OVERVALUED
Our Excess Returns analysis suggests Tradeweb Markets may be overvalued by 54.9%. Discover 879 undervalued stocks or create your own screener to find better value opportunities.
Approach 2: Tradeweb Markets Price vs Earnings
For profitable companies, the P/E ratio is a useful shorthand for what investors are currently willing to pay for each dollar of earnings. It ties the share price directly to the bottom line, which is usually the core driver of long term equity value.
What counts as a “normal” or “fair” P/E depends on how the market views a company’s growth potential and risk profile. Higher expected earnings growth or lower perceived risk can support a higher P/E, while slower growth or higher risk tends to justify a lower one.
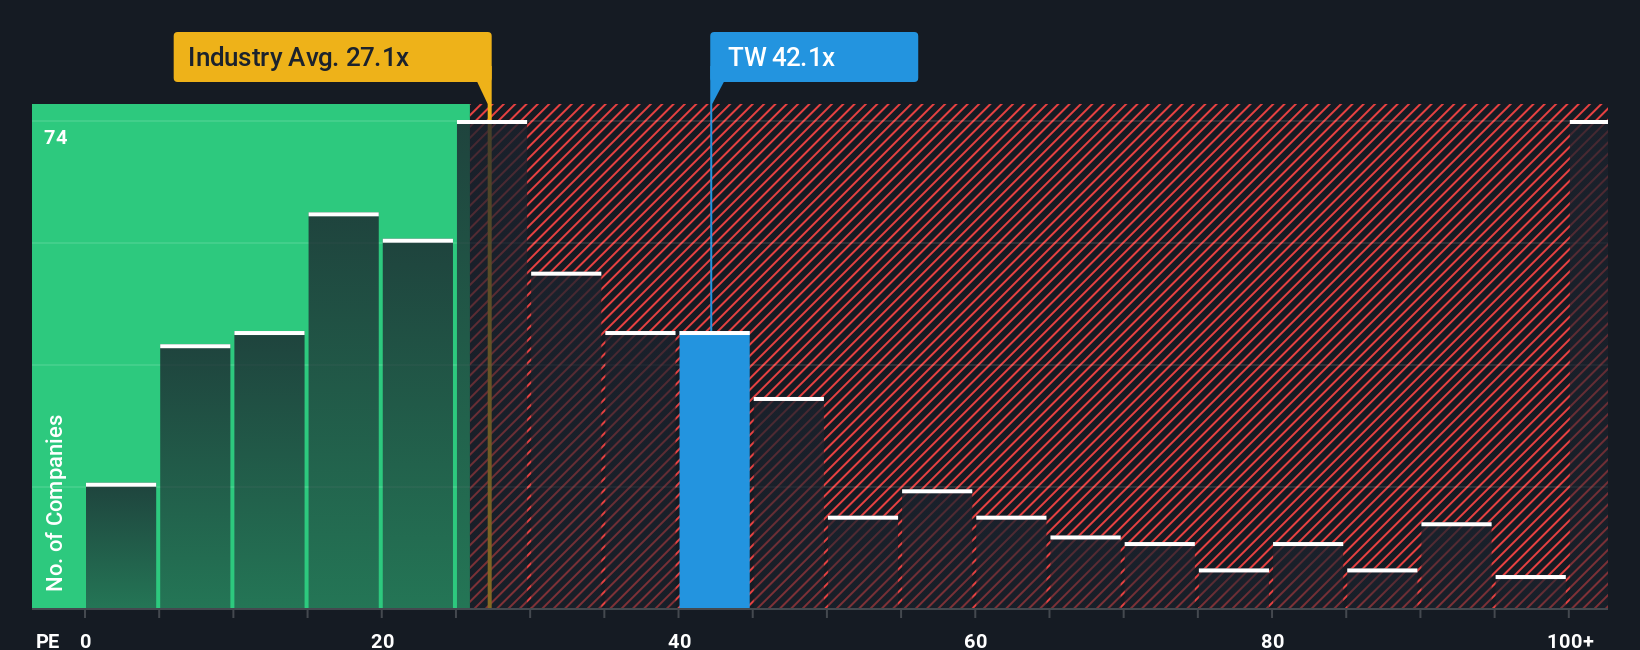
Tradeweb Markets currently trades on a P/E of 35.20x. That sits above the Capital Markets industry average of 25.61x and above the peer group average of 29.61x. Simply Wall St’s Fair Ratio for Tradeweb is 17.00x, which is its proprietary estimate of what a reasonable P/E might be given factors such as earnings growth, profit margins, industry, market cap and identified risks.
This Fair Ratio is more tailored than a simple peer or industry comparison because it adjusts for company specific characteristics rather than assuming all firms deserve similar multiples. Comparing Tradeweb’s current 35.20x P/E with the 17.00x Fair Ratio suggests the shares are trading on a richer multiple than this model would imply.
Result: OVERVALUED
P/E ratios tell one story, but what if the real opportunity lies elsewhere? Discover 1444 companies where insiders are betting big on explosive growth.
Upgrade Your Decision Making: Choose your Tradeweb Markets Narrative
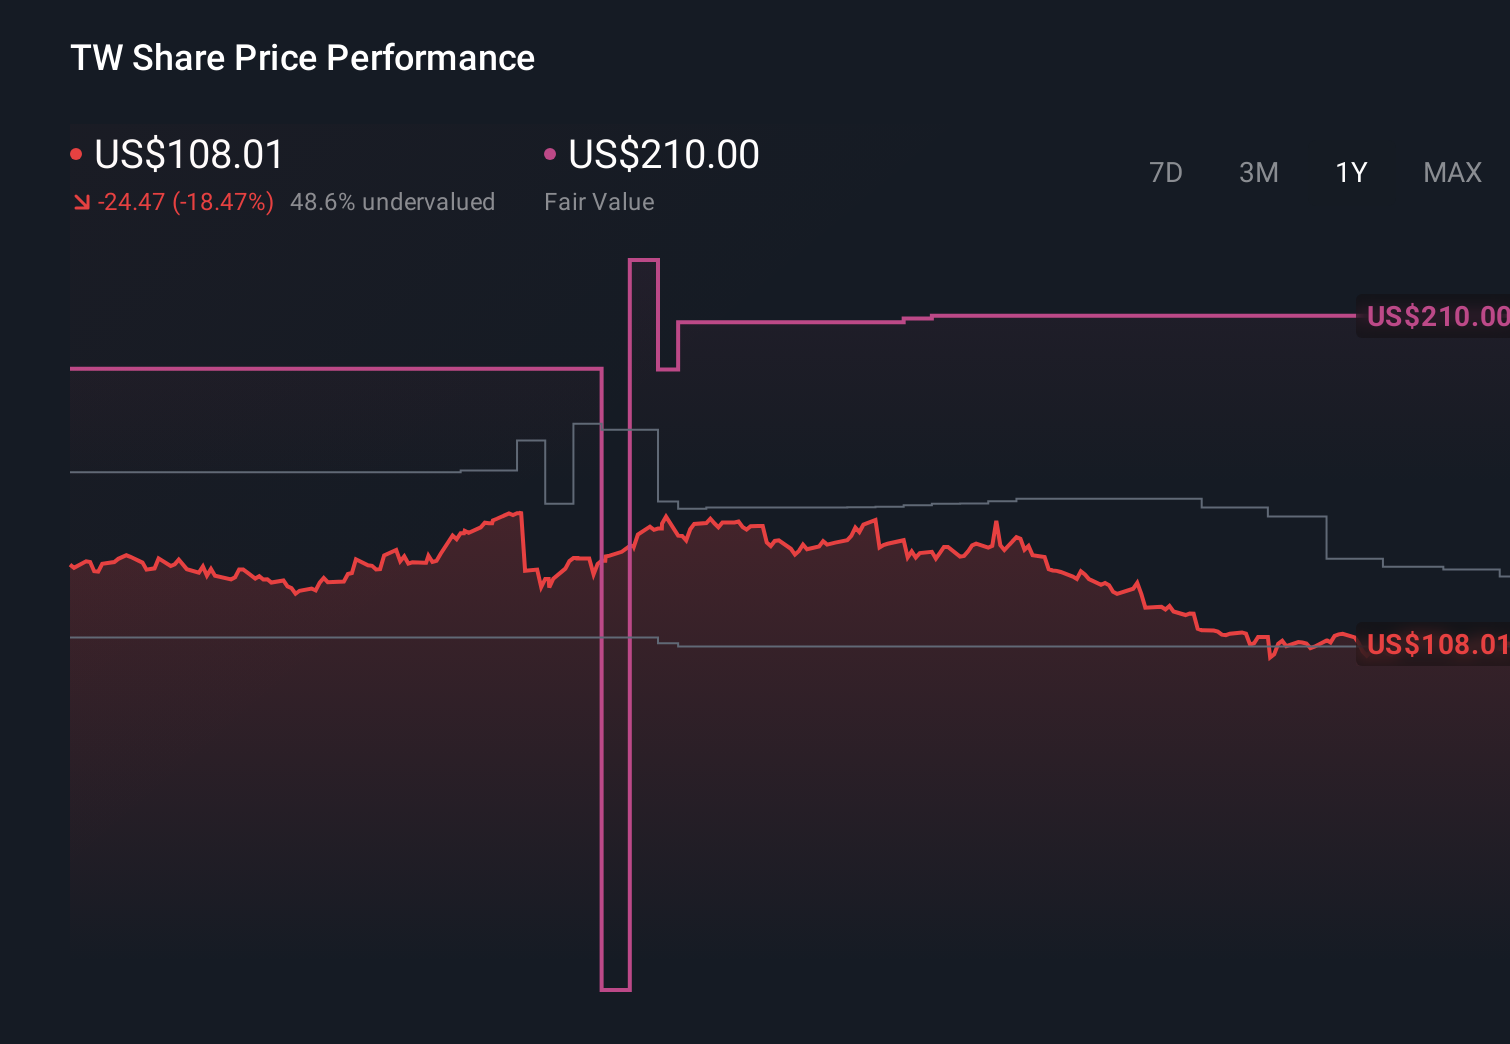
Earlier we mentioned that there is an even better way to understand valuation, so let us introduce you to Narratives. These are short, grounded stories you create about Tradeweb Markets that link your view of its business, your assumptions for future revenue, earnings and margins, and the fair value you assign to the shares. Narratives are created within an easy tool on Simply Wall St's Community page that millions of investors use to compare their Fair Value to the current price. You can also see that Narratives refresh when new news or earnings data is added, and understand why one investor might see Tradeweb close to the higher US$210 analyst target while another focuses on risks and aligns closer to the lower US$118 target.
Do you think there's more to the story for Tradeweb Markets? Head over to our Community to see what others are saying!
This article by Simply Wall St is general in nature. We provide commentary based on historical data and analyst forecasts only using an unbiased methodology and our articles are not intended to be financial advice. It does not constitute a recommendation to buy or sell any stock, and does not take account of your objectives, or your financial situation. We aim to bring you long-term focused analysis driven by fundamental data. Note that our analysis may not factor in the latest price-sensitive company announcements or qualitative material. Simply Wall St has no position in any stocks mentioned.