Is Transocean (RIG) Still Attractive After Recent 40% Surge And Mixed Valuation Signals
Transocean Ltd. RIG | 6.59 | +1.38% |
- If you are wondering whether Transocean at around US$6.00 is a bargain or a value trap, you are not alone, especially with offshore drilling back on many watchlists.
- The stock has returned 12.4% over the last 7 days, 40.5% over the last 30 days, 41.5% year to date and 61.3% over the last year, while the 3 year return is a 21.2% decline and the 5 year return is 63.5%.
- These moves have arrived alongside ongoing interest in offshore oil and gas activity, where Transocean often features in discussions about contract backlogs and drilling capacity. For many investors, this backdrop raises questions about how much of the recent enthusiasm is already reflected in the share price.
- Our valuation checks give Transocean a score of 1 out of 6. Next we will look at what different valuation methods say about that figure, and then finish by considering a broader way to think about the stock's value beyond the usual models.
Transocean scores just 1/6 on our valuation checks. See what other red flags we found in the full valuation breakdown.
Approach 1: Transocean Discounted Cash Flow (DCF) Analysis
A Discounted Cash Flow model estimates what a company might be worth by projecting future cash flows and then discounting them back to today’s value using a required return. It focuses on what the business could generate in cash, rather than just current earnings.
For Transocean, the model uses a 2 Stage Free Cash Flow to Equity approach. The latest twelve month free cash flow is about $141.5 million, and analysts provide explicit forecasts out to 2028, with Simply Wall St extrapolating further out to 2035. Within that period, projected free cash flows range between roughly $451.7 million and $675.5 million a year, all in US$.
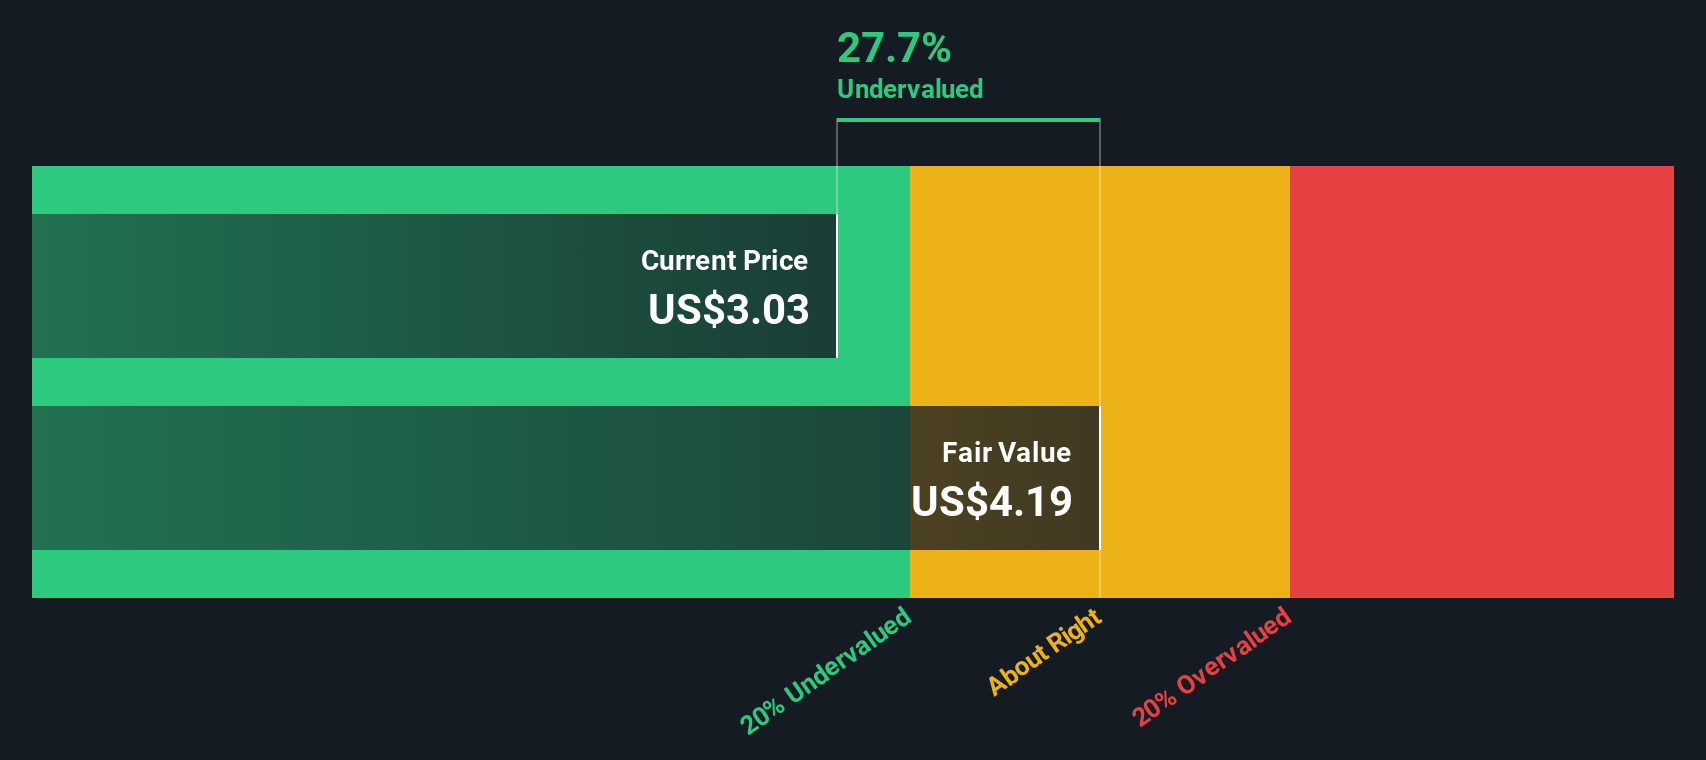
When these projected cash flows are discounted back, the model arrives at an estimated intrinsic value of about $6.77 per share. Compared with a share price around $6.00, this implies an 11.4% discount, which indicates the stock appears undervalued on this DCF view.
Result: UNDERVALUED
Our Discounted Cash Flow (DCF) analysis suggests Transocean is undervalued by 11.4%. Track this in your watchlist or portfolio, or discover 51 more high quality undervalued stocks.
Approach 2: Transocean Price vs Sales
For companies where profits can be volatile, the P/S ratio is often a useful cross check because it focuses on revenue rather than earnings that can swing with one off items or heavy depreciation. Investors usually accept a higher or lower P/S depending on what they expect for future growth and how risky they see those cash flows to be, so a “normal” range is rarely one size fits all.
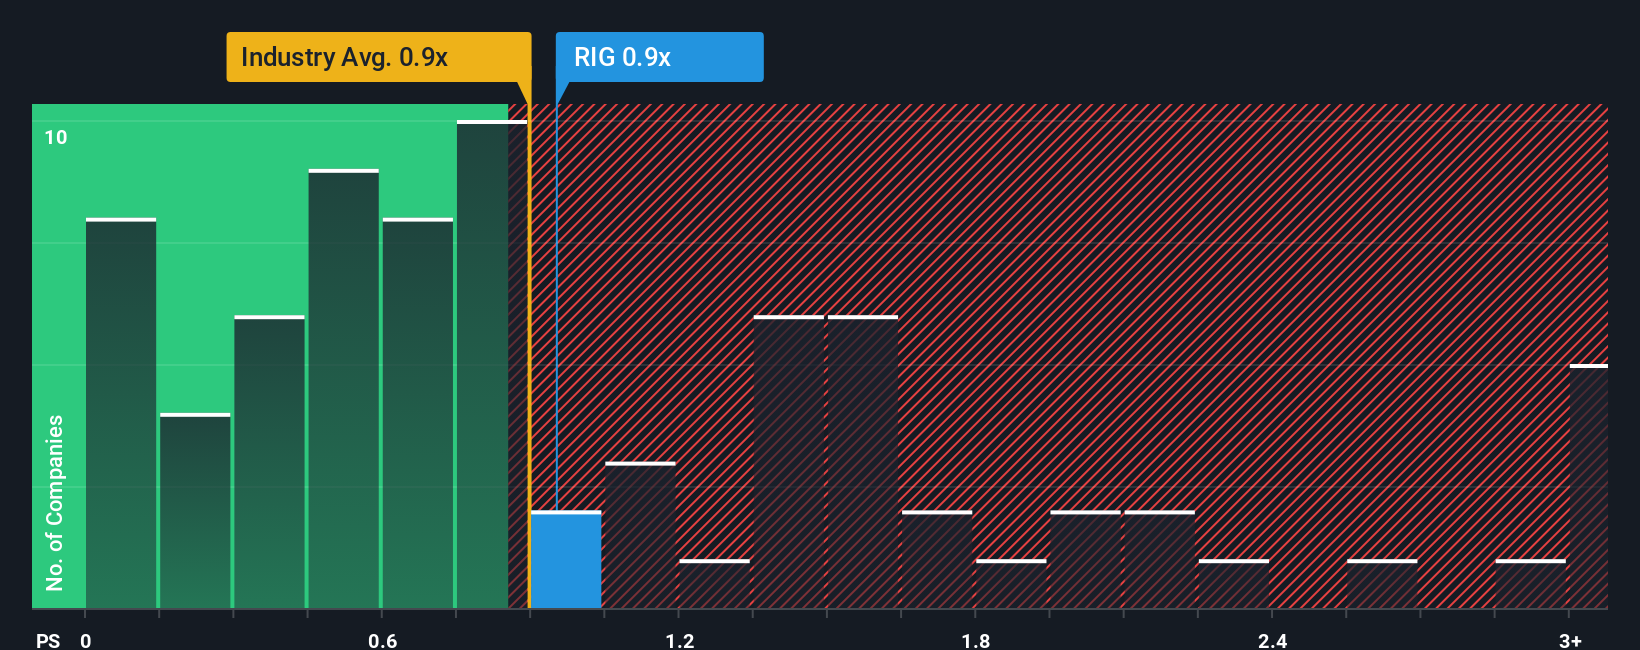
Transocean currently trades on a P/S of 1.71x, compared with the Energy Services industry average of 1.26x and a peer average of 1.54x. Simply Wall St’s Fair Ratio for Transocean is 1.13x, which is the P/S level its model suggests based on factors like earnings growth, margins, industry, market value and company specific risks.
This Fair Ratio can be more informative than a simple comparison to peers or the broader industry because it adjusts for Transocean’s own characteristics rather than assuming it should trade in line with an average. With the current P/S of 1.71x sitting above the Fair Ratio of 1.13x, the shares appear expensive on this metric.
Result: OVERVALUED
P/S ratios tell one story, but what if the real opportunity lies elsewhere? Start investing in legacies, not executives. Discover our 22 top founder-led companies.
Upgrade Your Decision Making: Choose your Transocean Narrative
Earlier we mentioned that there is an even better way to understand valuation, so let us introduce you to Narratives. Narratives are simply your story about Transocean, linked directly to a forecast for revenue, earnings and margins, and then to a fair value that you can compare with the current share price inside the Narratives tool on Simply Wall St’s Community page. Each Narrative updates automatically when new information like contracts, news or earnings is released. One investor might align with a higher fair value such as US$5.50 because they expect revenue growth of about 2.0% a year and earnings of roughly US$250.4 million by 2028. Another might lean toward a lower fair value such as US$2.50 based on an assumed 3.4% annual revenue decline and a different profit outlook. Seeing those stories side by side can help you decide which assumptions feel more realistic to you.
Do you think there's more to the story for Transocean? Head over to our Community to see what others are saying!

This article by Simply Wall St is general in nature. We provide commentary based on historical data and analyst forecasts only using an unbiased methodology and our articles are not intended to be financial advice. It does not constitute a recommendation to buy or sell any stock, and does not take account of your objectives, or your financial situation. We aim to bring you long-term focused analysis driven by fundamental data. Note that our analysis may not factor in the latest price-sensitive company announcements or qualitative material. Simply Wall St has no position in any stocks mentioned.