Is TransUnion (TRU) Pricing Look Attractive After A 25% One Year Share Price Decline
TransUnion TRU | 74.81 74.81 | +3.33% 0.00% Pre |
- If you are wondering whether TransUnion is attractively priced at its current level, this article will walk you through what the numbers are saying about the stock.
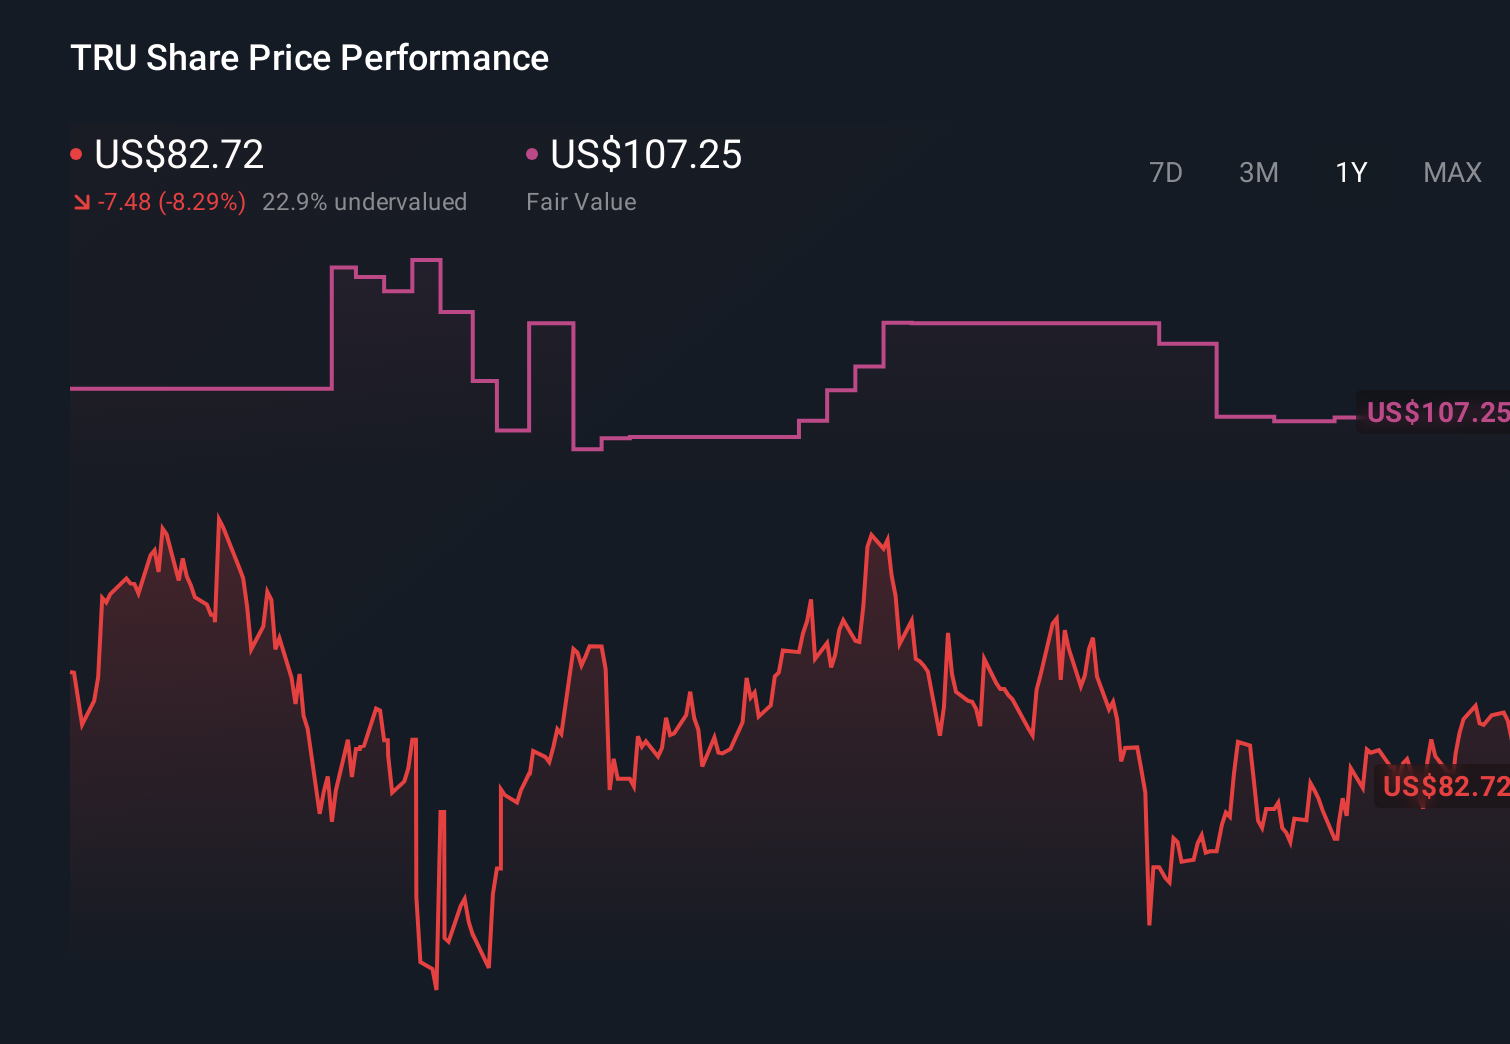
- The share price closed at US$73.92 most recently, with returns of 0.6% over 7 days, a 13.5% decline over 30 days, an 11.3% decline year to date, a 25.5% decline over 1 year, an 8.5% gain over 3 years, and a 15.1% decline over 5 years.
- Recent price moves sit against a steady flow of evergreen interest in TransUnion, as investors regularly reassess how much they are willing to pay for credit and data services exposure. In that context, it can be useful to step back from short term headlines and look closely at how various valuation methods line up for this business.
- On our structured valuation checks, TransUnion currently scores 4 out of 6, which suggests several traditional metrics may indicate undervaluation. Next, we will compare different valuation approaches and then finish with a broader way to think about what the stock might be worth.
Approach 1: TransUnion Discounted Cash Flow (DCF) Analysis
A DCF model takes expected future cash flows, then discounts them back into today’s dollars to estimate what the business might be worth right now. It is essentially asking what you would pay today for the cash TransUnion is projected to generate over time.
TransUnion’s latest twelve month free cash flow is about $641.4 million. Using a 2 Stage Free Cash Flow to Equity model, analysts and extrapolated estimates point to free cash flow of $881.6 million in 2026, rising to $1,418.0 million in 2028, with further projections out to 2035 based on Simply Wall St assumptions. All of these cash flows are modeled in dollars and then discounted back to today.
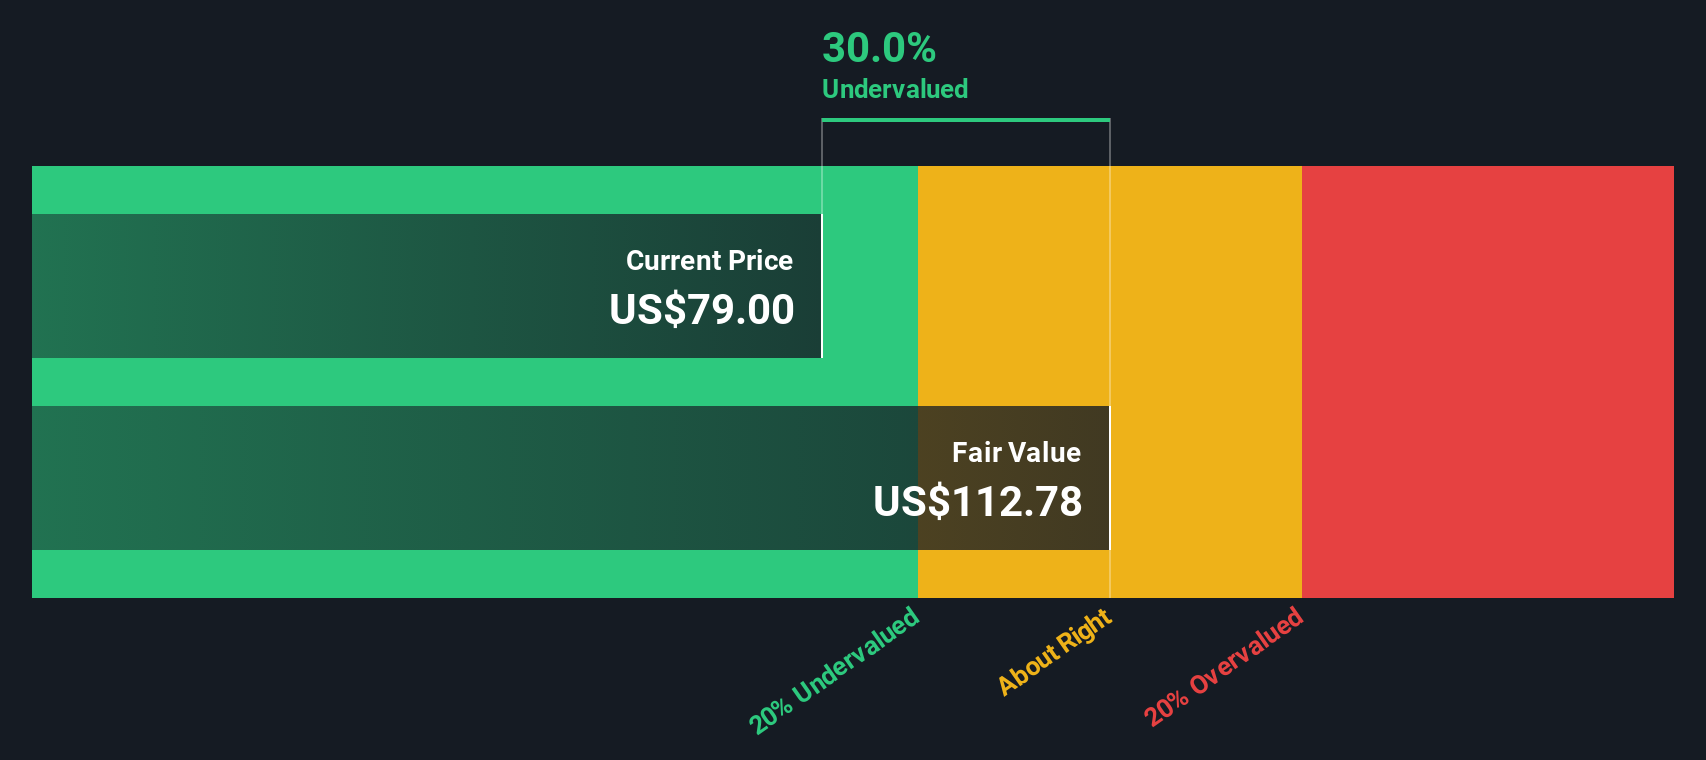
On this basis, the DCF model arrives at an estimated intrinsic value of about $222.58 per share. Compared with the recent share price of $73.92, this implies the stock screens as 66.8% undervalued according to this method.
Result: UNDERVALUED
Our Discounted Cash Flow (DCF) analysis suggests TransUnion is undervalued by 66.8%. Track this in your watchlist or portfolio, or discover 53 more high quality undervalued stocks.
Approach 2: TransUnion Price vs Earnings
For a profitable business like TransUnion, the P/E ratio is a useful shorthand for what investors are currently willing to pay for each dollar of earnings. It ties the share price directly to the company’s bottom line, which is often where the market’s focus sits for established, earnings generating companies.
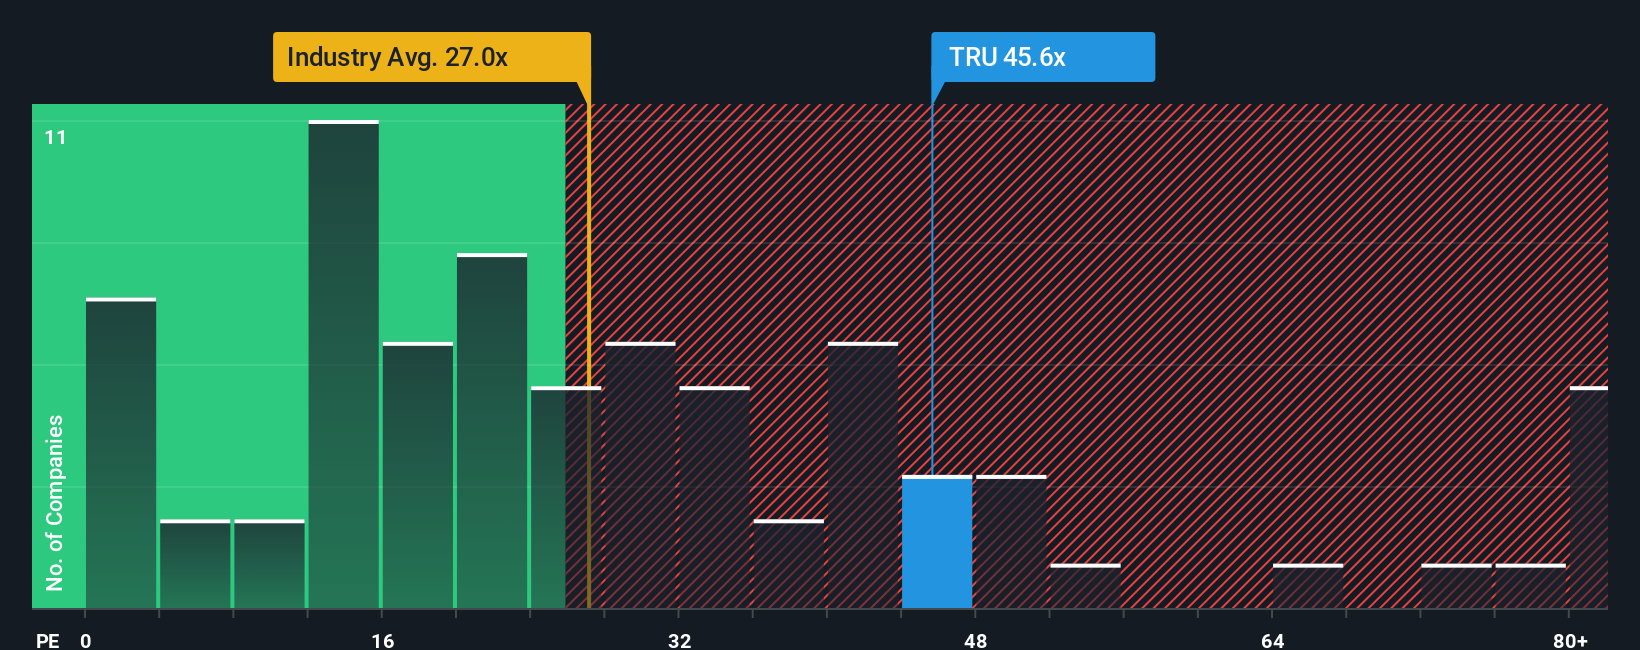
What counts as a “normal” P/E depends a lot on growth expectations and perceived risk. Higher expected earnings growth or lower risk can support a higher multiple, while slower growth or higher risk usually calls for a lower one. Right now, TransUnion trades on a P/E of 31.23x, compared with the Professional Services industry average of 19.40x and a peer group average of 28.79x.
Simply Wall St’s Fair Ratio for TransUnion is 31.69x. This is a proprietary estimate of what the P/E “should” be, given factors such as earnings growth profile, industry, profit margins, market cap and company specific risks. Because it incorporates these drivers directly, it can be more tailored than a simple comparison with broad industry or peer averages. With the current P/E of 31.23x sitting very close to the Fair Ratio of 31.69x, the stock screens as about fairly valued on this metric.
Result: ABOUT RIGHT
P/E ratios tell one story, but what if the real opportunity lies elsewhere? Start investing in legacies, not executives. Discover our 23 top founder-led companies.
Upgrade Your Decision Making: Choose your TransUnion Narrative
Earlier we mentioned that there is an even better way to understand valuation. On Simply Wall St’s Community page you can use Narratives, where you and other investors link a simple story about TransUnion to explicit numbers like expected revenue, earnings, margins and a fair value estimate. You can then see how that fair value compares with today’s price, with each Narrative updating automatically when fresh news or earnings arrive. One investor might build a higher fair value around themes like AI, analytics and rental data partnerships supporting revenue and margin assumptions closer to the US$135.0 price target. A more cautious investor might focus on risks such as regulation, competition and cyber threats to justify assumptions that line up nearer the US$84.0 target.
Do you think there's more to the story for TransUnion? Head over to our Community to see what others are saying!
This article by Simply Wall St is general in nature. We provide commentary based on historical data and analyst forecasts only using an unbiased methodology and our articles are not intended to be financial advice. It does not constitute a recommendation to buy or sell any stock, and does not take account of your objectives, or your financial situation. We aim to bring you long-term focused analysis driven by fundamental data. Note that our analysis may not factor in the latest price-sensitive company announcements or qualitative material. Simply Wall St has no position in any stocks mentioned.