

Is Trinity Capital (TRIN) Overvalued As Revenue Rises But EPS Falls?
Trinity Capital, Inc. TRIN | 0.00 |
Why Trinity Capital Earnings Matter For Shareholders
Trinity Capital (TRIN) just reported second quarter 2026 results that showed higher revenue and net income than a year ago, while earnings per share from continuing operations moved in the opposite direction.
The company posted second quarter revenue of US$87.17 million and net income of US$44.41 million, compared with US$69.48 million and US$41.41 million in the prior year period. Basic and diluted EPS from continuing operations were US$0.49, compared with US$0.63 a year earlier.
The latest earnings news has come alongside a solid run in Trinity Capital’s stock, with a 22.46% year to date share price return and a 34.74% total shareholder return over the past year, pointing to improving momentum from recent levels.
If these results have you thinking about where else market interest could build, it may be a good time to scan for new ideas through our 19 top founder-led companies
With Trinity Capital shares already up strongly over the past year and trading close to recent price targets, the key consideration is whether to add exposure now or wait for a more attractive entry point, as the valuation section discusses next.
Most Popular Narrative: 2.9% Overvalued
Trinity Capital last closed at $18.43, which sits slightly above the most followed narrative fair value estimate of $17.92 that uses a 9.28% discount rate.
Strong growth in venture debt deal flow, surging assets under management (AUM), and expansion into managed account platforms are fueling investor expectations for sustained double-digit revenue and earnings growth. The rapid pace of origination, however, raises the risk that future credit quality or loan demand could falter if the innovation/startup or venture capital ecosystem weakens unexpectedly.
Want to understand why this narrative still supports a premium to fair value? The entire framework rests on faster earnings growth, higher margins, and a future profit multiple that assumes this playbook holds. Curious which assumptions really move that $17.92 figure and what would need to change for the story to break.
Result: Fair Value of $17.92 (OVERVALUED)
However, Trinity Capital still faces key risks, including a potential pullback in venture funding and higher funding costs that could pressure credit quality and margins.
Another View On Trinity Capital’s Valuation
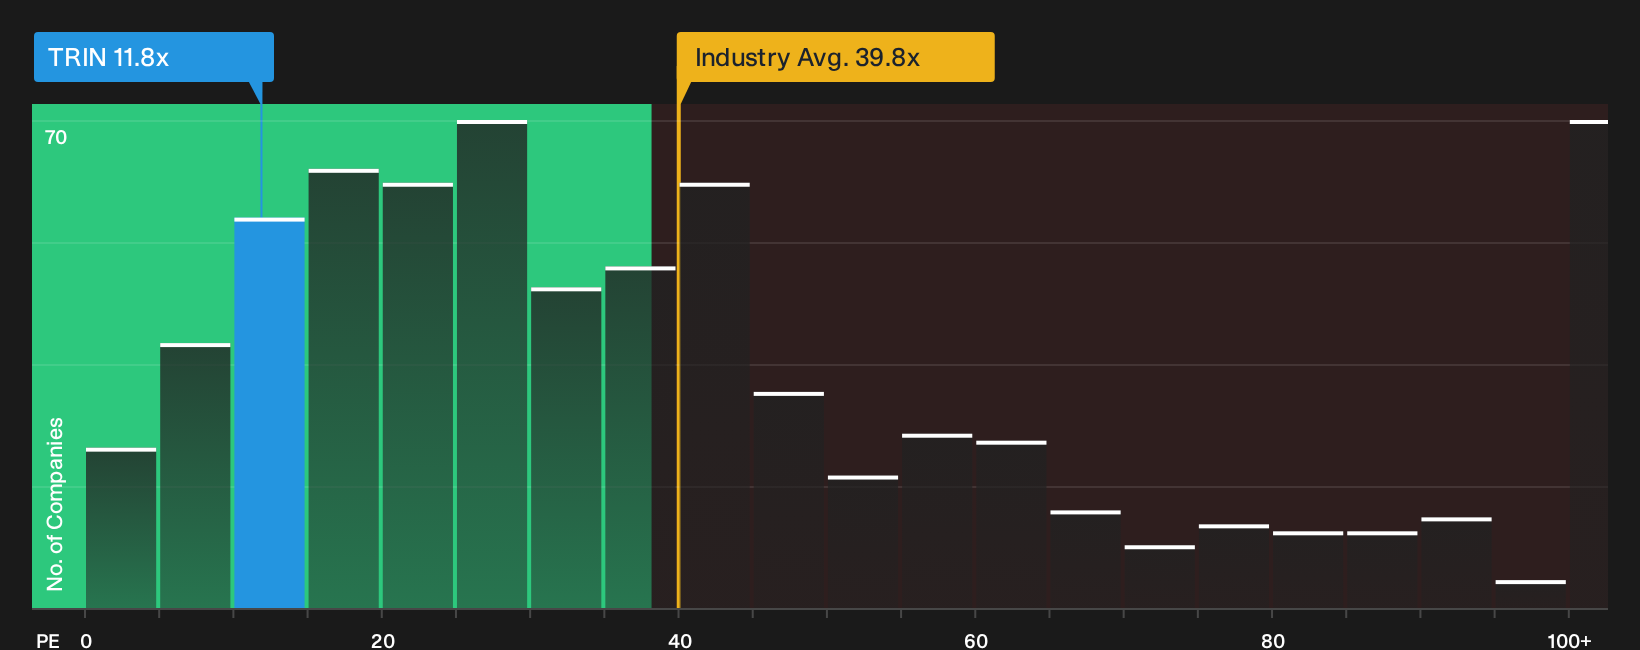
The first narrative frames Trinity Capital as about 2.9% overvalued relative to a $17.92 fair value. Yet the P/E picture looks different. The current P/E of 12.3x sits below a fair ratio of 13.4x and well below the US Capital Markets average of 37.9x and peer average of 13.1x. That gap could reflect either a valuation cushion or a potential warning, depending on how earnings and sentiment develop from here.
Next Steps
With Trinity Capital showing both areas of concern and clear positives in this article, it makes sense to review the numbers yourself and decide where you stand without delay. To weigh both sides in one place, take a closer look at the 4 key rewards and 4 important warning signs
Looking For More Investment Ideas Beyond Trinity Capital?
If Trinity Capital has sharpened your focus, do not stop here. Broader ideas can help you build a stronger watchlist and avoid missing opportunities others overlook.
- Spot potential turnaround opportunities early by scanning 20 elite penny stocks with strong financials that already back their stories with stronger financials.
- Strengthen your core holdings and aim for value with the 51 high quality undervalued stocks that filters for quality businesses at comparatively lower prices.
- Reduce stress and focus on resilience by checking the 83 resilient stocks with low risk scores that highlights companies with more stable profiles and lower risk scores.
This article by Simply Wall St is general in nature. We provide commentary based on historical data and analyst forecasts only using an unbiased methodology and our articles are not intended to be financial advice. It does not constitute a recommendation to buy or sell any stock, and does not take account of your objectives, or your financial situation. We aim to bring you long-term focused analysis driven by fundamental data. Note that our analysis may not factor in the latest price-sensitive company announcements or qualitative material. Simply Wall St has no position in any stocks mentioned.