Is Trinity Industries’ Shrinking Railcar Backlog Quietly Rewriting Its Competitive Story in TRN?
Trinity Industries, Inc. TRN | 0.00 |
- In recent analysis of Trinity Industries, investors learned that the company’s railcar backlog has fallen by an average 25.8% over the past two years, while its gross margins trail key competitors in North America.
- This combination of shrinking orders and thinner margins raises questions about Trinity’s ability to fund growth initiatives and maintain its competitive position in the railcar market.
- We’ll now examine how the weaker order backlog reshapes Trinity Industries’ existing investment narrative and the assumptions behind its outlook.
We've uncovered the 10 dividend fortresses yielding 5%+ that don't just survive market storms, but thrive in them.
Trinity Industries Investment Narrative Recap
To own Trinity Industries, you need to believe that rail remains a core freight solution and that Trinity can convert its scale into resilient cash generation, despite cyclicality. The sharp 25.8% average backlog decline and weaker margins directly test that belief, since near term earnings progress and the biggest current risk of softer order activity both hinge on Trinity proving it can stabilize demand and defend profitability. If backlog softness persists, that risk becomes more material.
The recent Q1 2026 earnings release and guidance update matter most in this context. Trinity reported lower revenue year on year but higher net income, and raised its 2026 EPS guidance to US$2.20 to US$2.40. That guidance now sits against a thinner backlog and inferior gross margins, which makes the company’s ability to execute on efficiency gains and cost control a key near term catalyst for validating, or challenging, the current outlook.
Yet behind the headline guidance increase, investors should be aware of how exposed Trinity remains to cyclical end markets like energy and agriculture...
Trinity Industries’ narrative projects $2.6 billion revenue and $118.9 million earnings by 2029. This implies 8.3% yearly revenue growth and an earnings decrease of $143.4 million from $262.3 million today.
Uncover how Trinity Industries' forecasts yield a $35.50 fair value, a 5% upside to its current price.
Exploring Other Perspectives
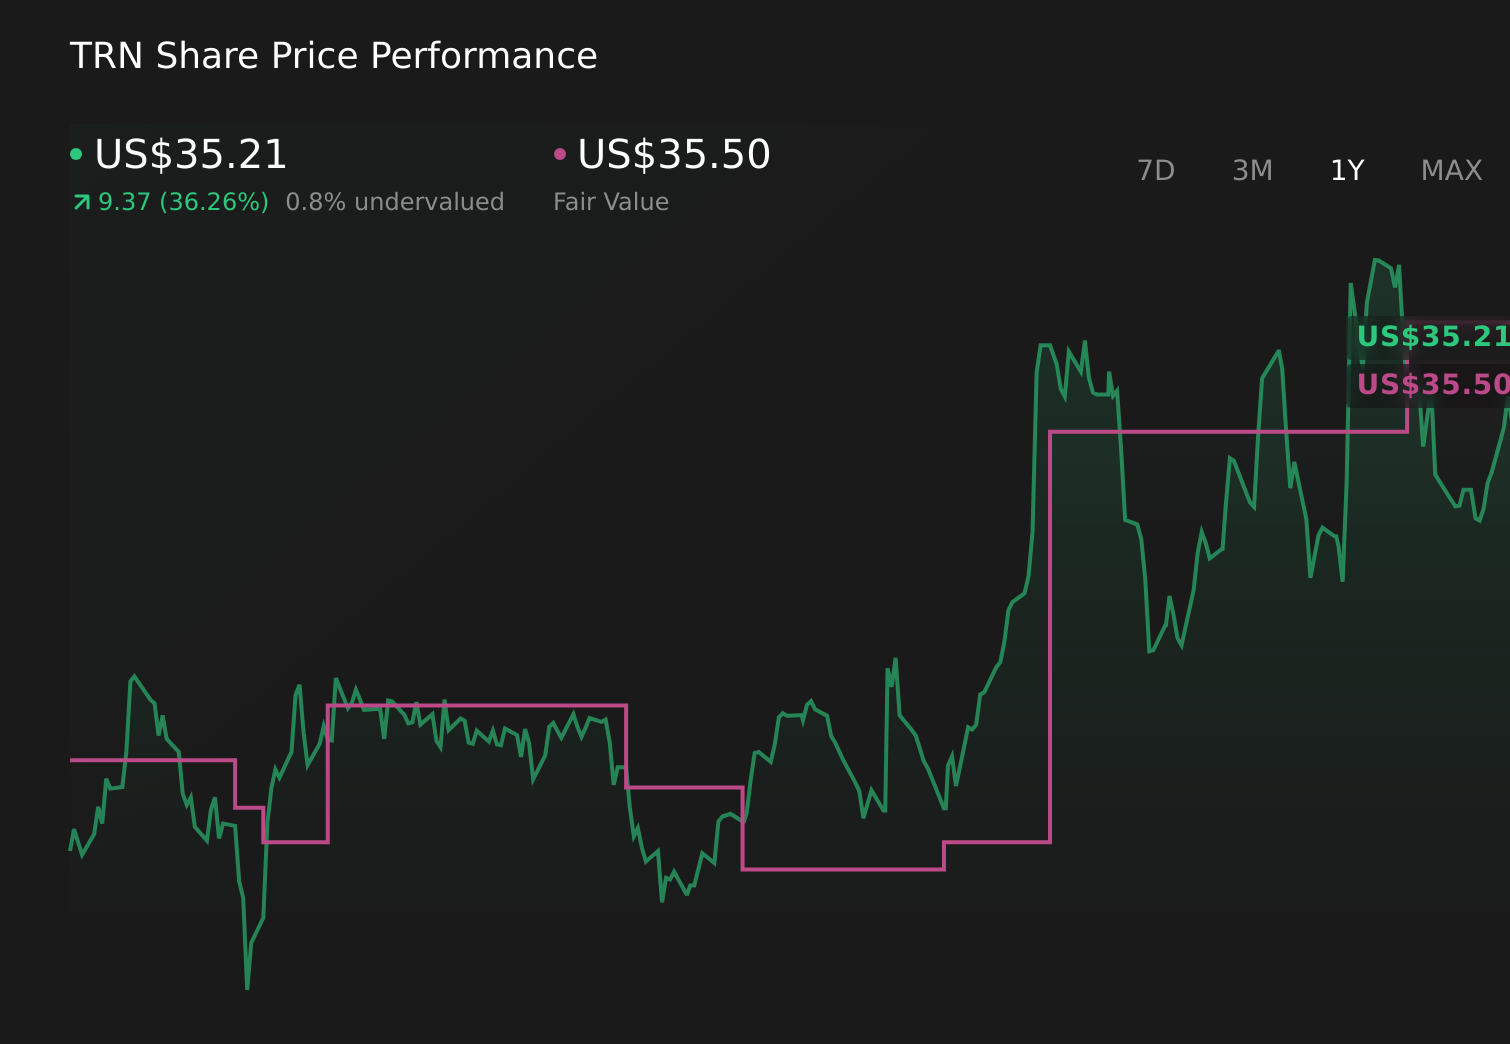
Two Simply Wall St Community fair value estimates for Trinity range widely, from about US$21.14 to US$35.50, underlining how far apart individual views can be. You can contrast those opinions with the risk that a weaker railcar backlog and thinner margins limit Trinity’s ability to grow earnings, and decide which assumptions about future performance you find more convincing.
Explore 2 other fair value estimates on Trinity Industries - why the stock might be worth as much as 5% more than the current price!
Reach Your Own Conclusion
Disagree with existing narratives? Extraordinary investment returns rarely come from following the herd, so go with your instincts.
- A great starting point for your Trinity Industries research is our analysis highlighting 3 key rewards and 4 important warning signs that could impact your investment decision.
- Our free Trinity Industries research report provides a comprehensive fundamental analysis summarized in a single visual - the Snowflake - making it easy to evaluate Trinity Industries' overall financial health at a glance.
Want Some Alternatives?
Right now could be the best entry point. These picks are fresh from our daily scans. Don't delay:
- Capitalize on the AI infrastructure supercycle with our selection of the 44 best 'picks and shovels' of the AI gold rush converting record-breaking demand into massive cash flow.
- Uncover the next big thing with 27 elite penny stocks that balance risk and reward.
- Invest in the nuclear renaissance through our list of 88 elite nuclear energy infrastructure plays powering the global AI revolution.
This article by Simply Wall St is general in nature. We provide commentary based on historical data and analyst forecasts only using an unbiased methodology and our articles are not intended to be financial advice. It does not constitute a recommendation to buy or sell any stock, and does not take account of your objectives, or your financial situation. We aim to bring you long-term focused analysis driven by fundamental data. Note that our analysis may not factor in the latest price-sensitive company announcements or qualitative material. Simply Wall St has no position in any stocks mentioned.