Is Tronox Holdings (TROX) Still Attractively Priced After Its 137% Year-To-Date Surge?
Tronox Holdings Plc TROX | 0.00 |
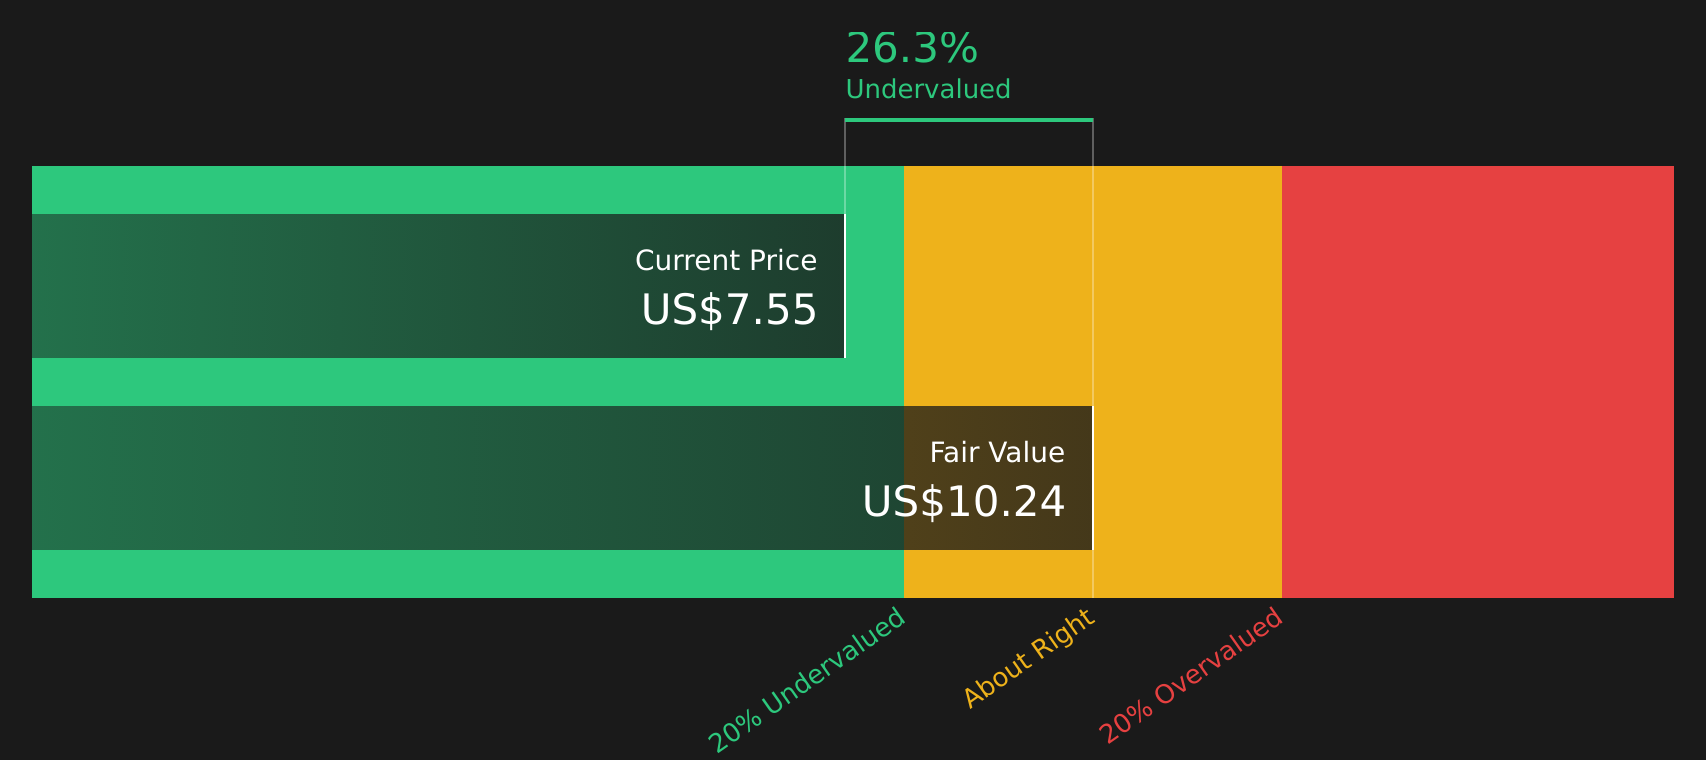
- Wondering if Tronox Holdings at around US$10.12 is still offering value after its recent run, or if most of the opportunity is already reflected in the price.
- The stock has returned 4.8% over the past week, 9.5% over the last month, 137.0% year to date, and 119.2% over the past year. Over the past 3 years the return is a 2.5% decline, and over the past 5 years it is a 44.4% decline.
- Recent coverage has focused on Tronox Holdings as investors reassess cyclical materials stocks and update expectations for the titanium dioxide market. These headlines help explain why the share price and sentiment around the stock have shifted so sharply over the last year.
- Tronox Holdings currently carries a value score of 4/6. The rest of this article compares different valuation approaches before turning to a more complete way to think about what that score really means for you.
Approach 1: Tronox Holdings Discounted Cash Flow (DCF) Analysis
A Discounted Cash Flow, or DCF, model estimates what a stock could be worth today by projecting future cash flows and discounting them back to the present.
For Tronox Holdings, the model used is a 2 Stage Free Cash Flow to Equity approach. The latest twelve month free cash flow is a loss of $259.3 million, so the model leans heavily on future projections. Analyst and extrapolated estimates suggest free cash flow turning positive and reaching $33.5 million in 2026, $57.7 million in 2027, and $95.5 million by 2028, rising further to about $270.2 million by 2035. All figures are in US$ and below $1b, so are referenced in millions.
Discounting these projected cash flows back to today gives an estimated intrinsic value of about $13.90 per share. Compared with a current share price around $10.12, the DCF output suggests the stock trades at roughly a 27.2% discount, which indicates potential undervaluation based on this model alone.
Result: UNDERVALUED
Our Discounted Cash Flow (DCF) analysis suggests Tronox Holdings is undervalued by 27.2%. Track this in your watchlist or portfolio, or discover 44 more high quality undervalued stocks.
Approach 2: Tronox Holdings Price vs Sales
For companies where earnings are weak or volatile, the P/S ratio is often more useful than P/E, because it compares the share price with the revenue the business generates rather than profits that can swing from year to year.
Growth expectations and risk still matter here. In general, higher expected growth and lower risk can justify a higher “normal” P/S ratio, while slower growth or greater uncertainty usually call for a lower multiple.
Tronox Holdings currently trades on a P/S ratio of 0.55x. That is below the Chemicals industry average of 1.18x, and modestly above the peer average of 0.51x. Simply Wall St’s Fair Ratio for Tronox Holdings is 1.08x, which is the P/S multiple suggested after looking at factors such as earnings growth, industry, profit margin, market cap and specific risks.
This Fair Ratio can be more useful than a simple peer or industry comparison because it adjusts for the company’s own growth profile, risk characteristics and profitability rather than assuming all stocks in the group deserve the same multiple.
With the current P/S at 0.55x compared with a Fair Ratio of 1.08x, Tronox Holdings screens as undervalued on this measure.
Result: UNDERVALUED

P/S ratios tell one story, but what if the real opportunity lies elsewhere? Start investing in legacies, not executives. Discover our 19 top founder-led companies.
Upgrade Your Decision Making: Choose your Tronox Holdings Narrative
Earlier it was mentioned that there is an even better way to understand valuation, so Narratives are introduced here as your way of attaching a clear story about Tronox Holdings to the numbers by setting your own expectations for revenue, earnings and margins. You can link that story to a financial forecast and a Fair Value, then compare it with the current price to consider whether the stock looks interesting or stretched. All of this happens inside Simply Wall St's Community page, where Narratives update automatically when new news or earnings arrive. One investor might build a more optimistic Tronox Holdings Narrative around a Fair Value closer to US$11.00 that focuses on faster cost savings, rare earth opportunities and higher revenue growth. Another investor might build a more cautious Narrative closer to US$4.00 that focuses on regulatory pressure, high debt and industry overcapacity. Both views can coexist on the platform so you can see how different assumptions lead to very different Fair Values.
Do you think there's more to the story for Tronox Holdings? Head over to our Community to see what others are saying!

This article by Simply Wall St is general in nature. We provide commentary based on historical data and analyst forecasts only using an unbiased methodology and our articles are not intended to be financial advice. It does not constitute a recommendation to buy or sell any stock, and does not take account of your objectives, or your financial situation. We aim to bring you long-term focused analysis driven by fundamental data. Note that our analysis may not factor in the latest price-sensitive company announcements or qualitative material. Simply Wall St has no position in any stocks mentioned.