

Is TTM Technologies (TTMI) Still Attractively Priced After Its 1 Year 252.9% Surge
TTM Technologies, Inc. TTMI | 0.00 |
- If you are wondering whether TTM Technologies is still reasonably priced after a strong run, this article walks through how its current share price stacks up against several valuation yardsticks.
- The stock closed at US$92.33, with a 7 day return of 0.3%, a 30 day return of 1.0%, a year to date return of 30.8% and a 1 year return of 252.9%, so recent gains may have shifted how investors see both its potential and its risks.
- Recent coverage has focused on TTM Technologies as an electronics manufacturer supplying printed circuit boards and related products for high reliability end markets. This has helped frame the stock as a way to gain exposure to long term technology demand, and commentary has also highlighted how expectations around that demand are feeding into today’s pricing.
- Our valuation framework scores TTM Technologies at 3 out of 6 on underpricing checks. Next, we will walk through the main valuation approaches investors commonly use, and then finish with a way to look at valuation that goes beyond any single model.
Approach 1: TTM Technologies Discounted Cash Flow (DCF) Analysis
A Discounted Cash Flow, or DCF, model estimates what a company might be worth by projecting its future cash flows and discounting them back to today’s value using a required return.
For TTM Technologies, the model used is a 2 Stage Free Cash Flow to Equity approach. The latest twelve month Free Cash Flow is about $96.4 million. Based on analyst input for 2027 and further extrapolated estimates, Simply Wall St projects Free Cash Flow reaching about $2.29 billion in 2035, with intermediate years ranging from $37.4 million in 2026 to just over $2.06 billion in 2034. All cash flows are in US$.
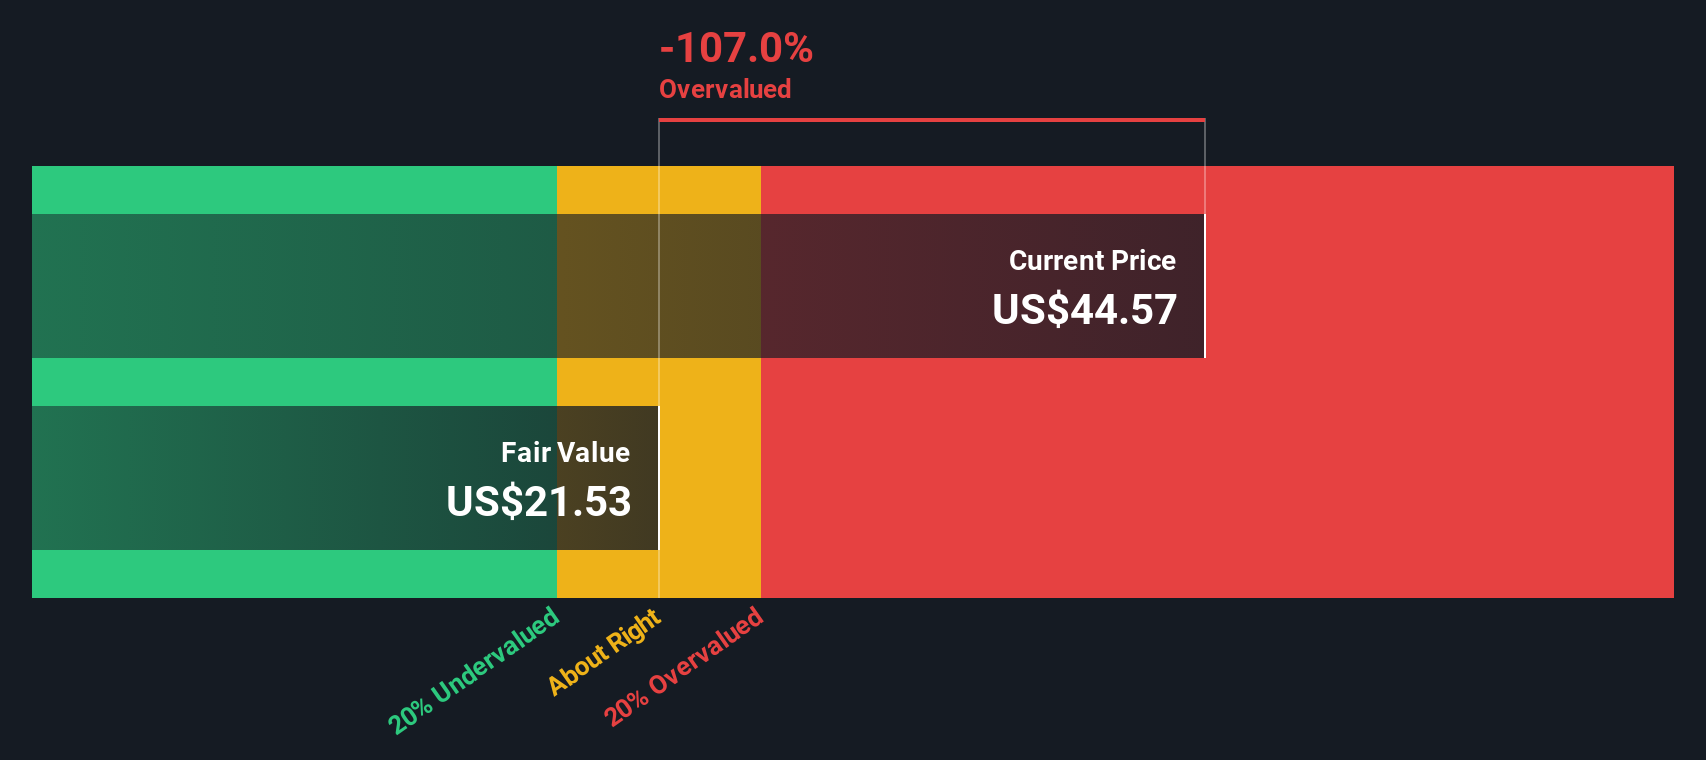
Discounting this stream of projected cash flows results in an estimated intrinsic value of about $251.91 per share. Against the recent share price of $92.33, this implies the stock is around 63.3% below that DCF estimate, which is interpreted in this model as indicating the shares may be undervalued.
Result: UNDERVALUED
Our Discounted Cash Flow (DCF) analysis suggests TTM Technologies is undervalued by 63.3%. Track this in your watchlist or portfolio, or discover 55 more high quality undervalued stocks.
Approach 2: TTM Technologies Price vs Earnings
For profitable companies, the P/E ratio is a useful way to connect what you pay per share with the earnings the business is currently generating. It lets you compare how the market is valuing each dollar of earnings across different companies and sectors.
What counts as a “normal” P/E often reflects how the market views a company’s growth potential and risk. Higher expected growth or perceived resilience can support a higher multiple, while higher risk or weaker prospects can justify a lower one.
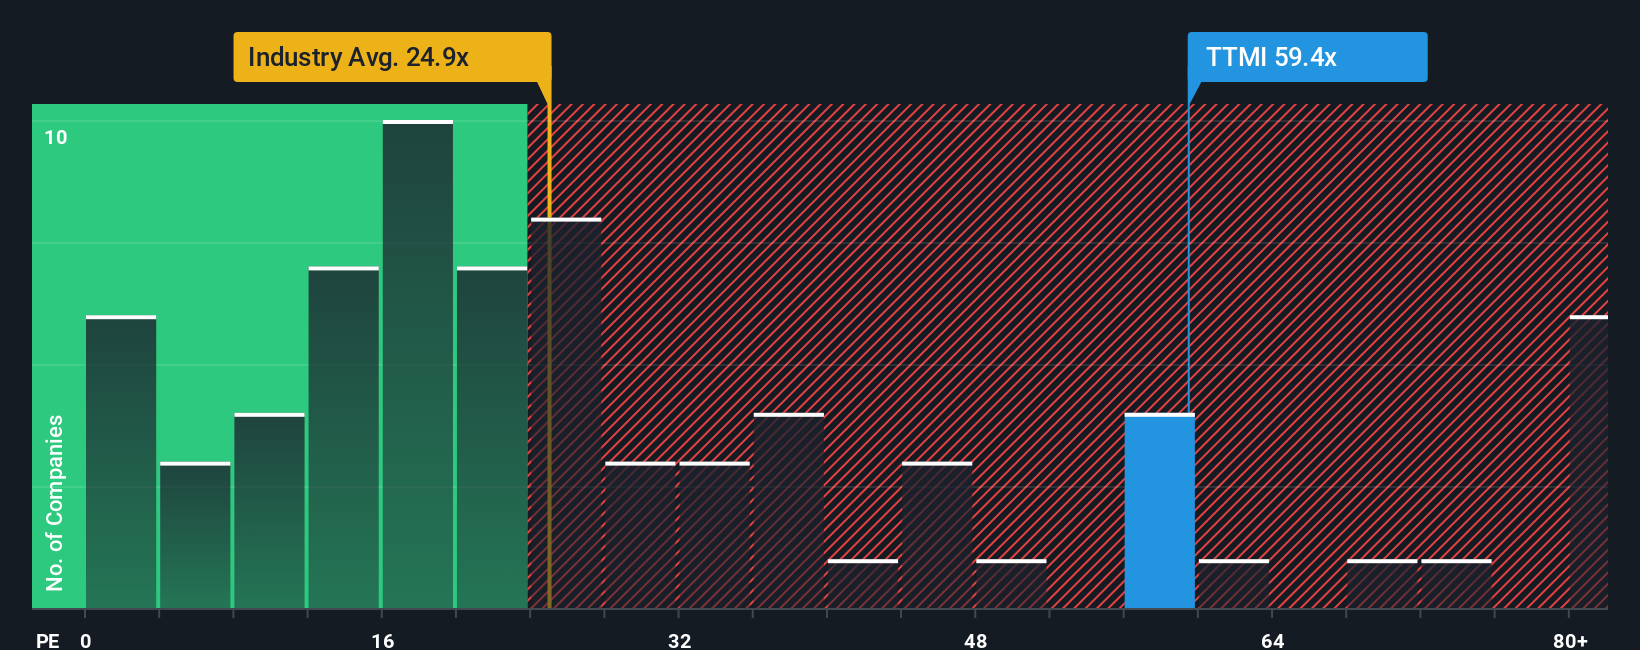
TTM Technologies currently trades on a P/E of 53.77x. That is higher than the Electronic industry average of 27.07x and also above the peer group average of 33.65x. Simply Wall St’s Fair Ratio for TTM Technologies is 50.62x, which is its proprietary estimate of an appropriate P/E given factors such as earnings growth, profit margins, industry, market cap and company specific risks.
This Fair Ratio aims to be more tailored than a simple comparison with peers or the industry, because it adjusts for the company’s own growth outlook and risk profile rather than assuming all firms deserve similar multiples. With the current P/E modestly above the Fair Ratio, the shares screen as slightly expensive on this metric.
Result: OVERVALUED
P/E ratios tell one story, but what if the real opportunity lies elsewhere? Start investing in legacies, not executives. Discover our 23 top founder-led companies.
Upgrade Your Decision Making: Choose your TTM Technologies Narrative
Earlier we mentioned that there is an even better way to think about valuation, so let us introduce Narratives. With Narratives you write the story behind your numbers by linking your view of TTM Technologies to specific assumptions for future revenue, earnings, margins and a fair value that you can compare with today’s price.
On Simply Wall St’s Community page, Narratives are an easy tool that helps you connect what you believe about TTM Technologies, such as how data center demand or aerospace and defense contracts might affect the business, to a clear financial forecast and a Fair Value estimate that automatically updates as new earnings, news or guidance arrive.
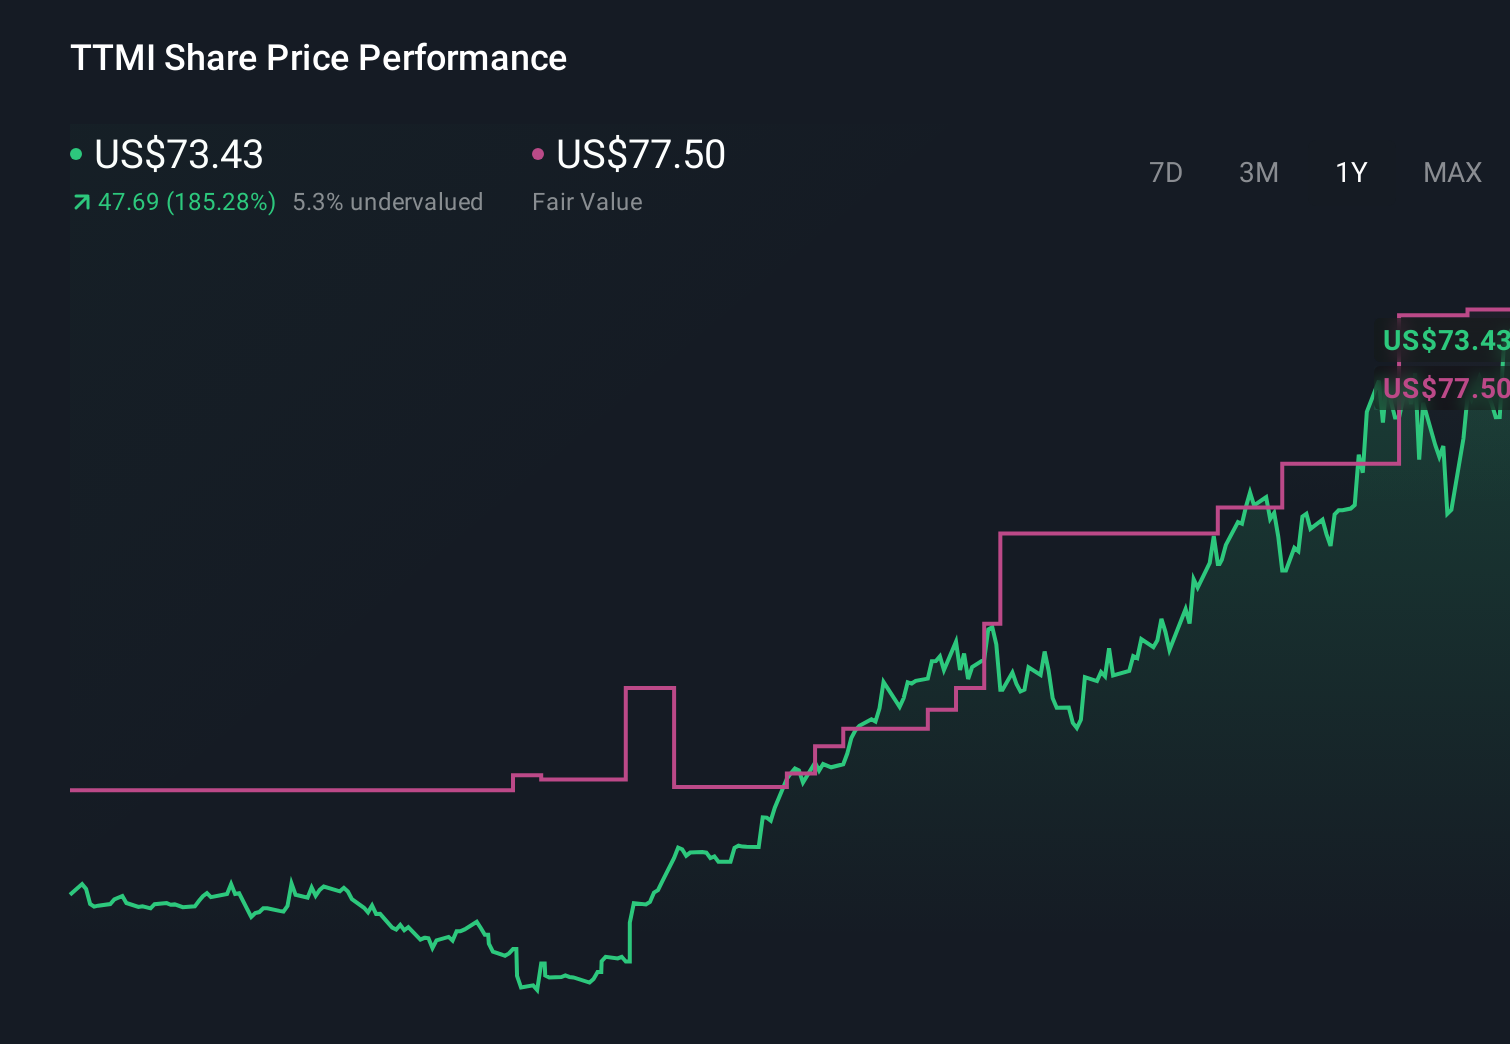
For example, one Narrative might lean closer to the higher fair value of US$123.00 with faster revenue growth and higher margins, while another might sit nearer to the lower fair value of US$72.00 with more conservative assumptions. By comparing each Fair Value with the current share price you can decide whether the stock looks closer to your idea of attractively priced, fairly priced or expensive given your own story.
For TTM Technologies however, we will make it really easy for you with previews of two leading TTM Technologies Narratives:
Fair value: US$103.25 per share
Current price vs this fair value: about 10.6% below this narrative’s estimate
Revenue growth assumption: 13.73% a year
- Analysts in this camp see AI data center projects, cloud spending and defense programs as supportive for demand, helped by TTM’s facilities in Wisconsin, Penang and Syracuse.
- They expect a shift toward higher value engineered solutions and advanced PCB work to support higher margins and stronger cash generation over time.
- They also flag risks around high operating costs, customer concentration, geopolitical exposure and ongoing heavy capital spending, which could all affect how much of that growth translates into earnings.
Fair value: US$72.00 per share
Current price vs this fair value: about 28.3% above this narrative’s estimate
Revenue growth assumption: 8.06% a year
- This view focuses on TTM’s heavy exposure to aerospace, defense and AI related demand, where any slowdown in awards or data center build outs could affect revenue and adjusted EBITDA.
- It highlights execution risk around large capital projects in Penang and Syracuse, where slower ramp ups or weaker yields could keep margins and free cash flow under pressure.
- Customer concentration in a narrow group of high performance use cases and a smaller contribution from automotive are seen as adding to revenue and earnings volatility if key programs or designs change.
Taken together, these Narratives frame a wide valuation range for TTM Technologies and put real numbers around different assumptions on growth, margins and risk. If you want to go beyond the previews and see how other investors are joining the debate, you can Curious how numbers become stories that shape markets? Explore Community Narratives and test which story feels closer to your own view.
Do you think there's more to the story for TTM Technologies? Head over to our Community to see what others are saying!
This article by Simply Wall St is general in nature. We provide commentary based on historical data and analyst forecasts only using an unbiased methodology and our articles are not intended to be financial advice. It does not constitute a recommendation to buy or sell any stock, and does not take account of your objectives, or your financial situation. We aim to bring you long-term focused analysis driven by fundamental data. Note that our analysis may not factor in the latest price-sensitive company announcements or qualitative material. Simply Wall St has no position in any stocks mentioned.