Is U.S. Physical Therapy (USPH) Pricing Offer An Opportunity After Recent Share Price Weakness
U.S. Physical Therapy, Inc. USPH | 77.30 | +0.82% |
- If you are wondering whether U.S. Physical Therapy is fairly priced or offering room for value, this article is designed to walk you through what the current numbers suggest.
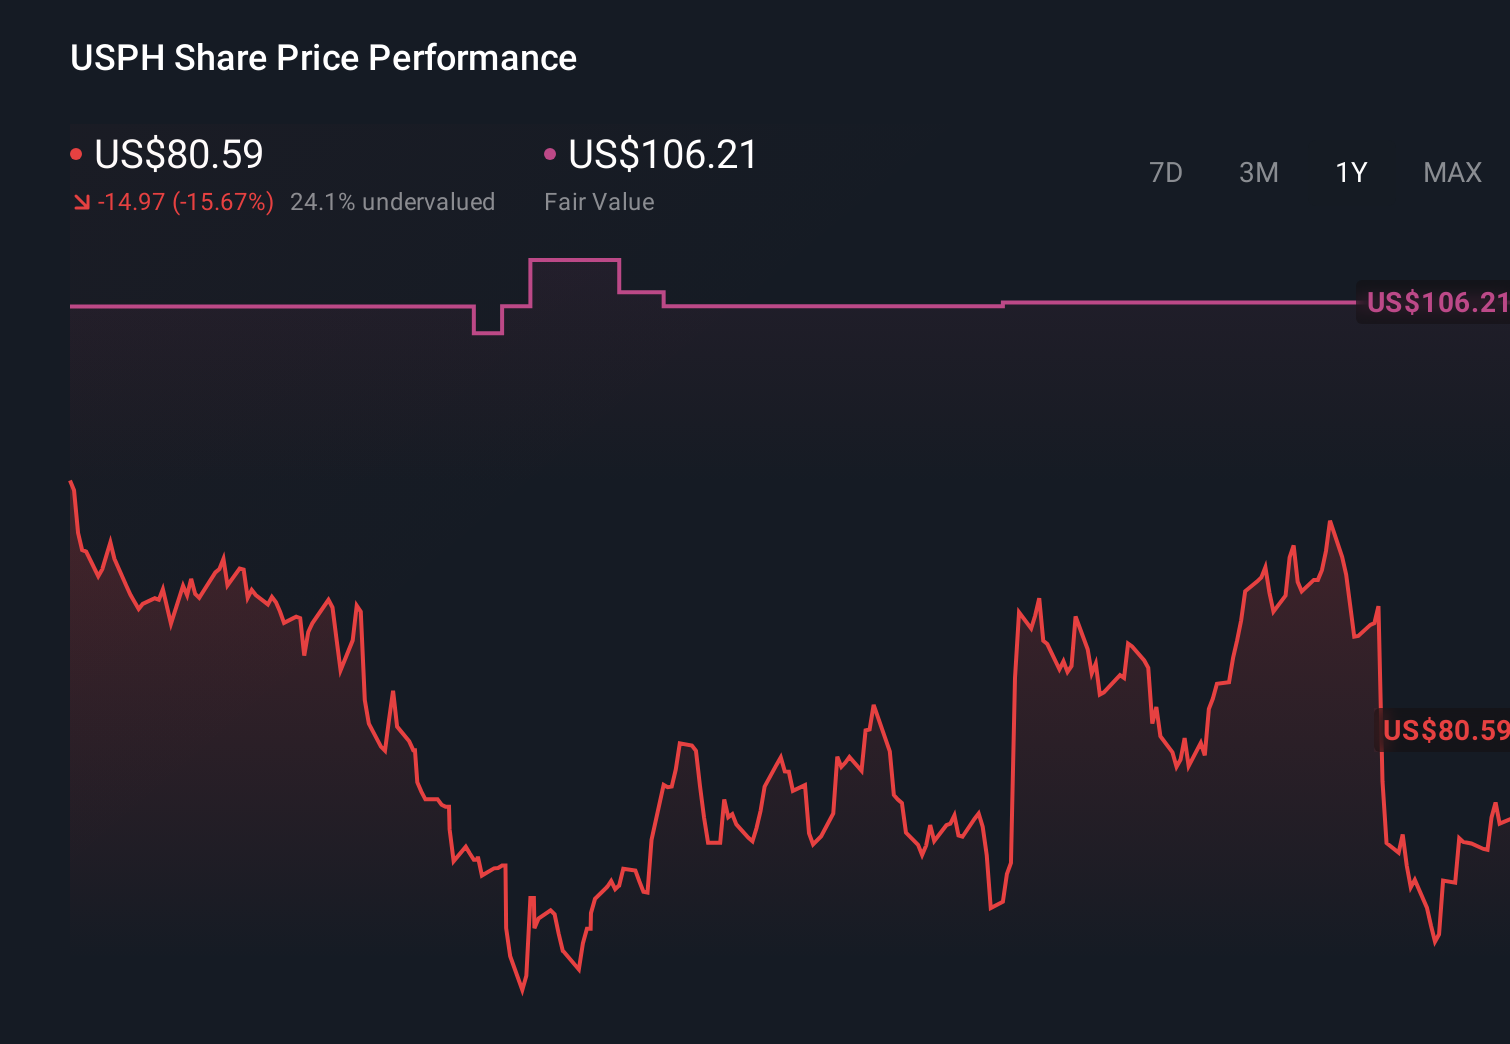
- The share price recently closed at US$85.58, with returns of 2.0% over 7 days, 7.7% over 30 days, 8.5% year to date, 0.6% over 1 year, a 7.5% decline over 3 years, and a 32.5% decline over 5 years.
- These mixed return figures sit against a backdrop of ongoing interest in outpatient physical therapy providers in the U.S. healthcare sector. Investors are watching how companies like U.S. Physical Therapy balance growth ambitions, acquisition activity, and cost management as care models evolve.
- On our valuation checks, U.S. Physical Therapy currently scores 3 out of 6. Next, we will look at how different valuation approaches line up, before finishing with a framework that can help you make sense of the company’s value story.
Approach 1: U.S. Physical Therapy Discounted Cash Flow (DCF) Analysis
A Discounted Cash Flow model takes estimates of a company’s future cash flows and discounts them back to today using a required return, giving an estimate of what the entire business could be worth at present.
For U.S. Physical Therapy, the model used is a 2 Stage Free Cash Flow to Equity approach. The latest trailing twelve month Free Cash Flow is about $58.3 million. Analysts provide explicit forecasts for the early years, and Simply Wall St then extrapolates further, with projected Free Cash Flow of $118.6 million in 2035. All cash flows are modelled in dollars and then discounted back to today.
On this basis, the DCF output suggests an estimated intrinsic value of about $159.55 per share. Compared with the recent share price of $85.58, this implies a 46.4% discount, indicating that the stock is trading well below this model’s estimate of fair value.
Result: UNDERVALUED
Our Discounted Cash Flow (DCF) analysis suggests U.S. Physical Therapy is undervalued by 46.4%. Track this in your watchlist or portfolio, or discover 53 more high quality undervalued stocks.

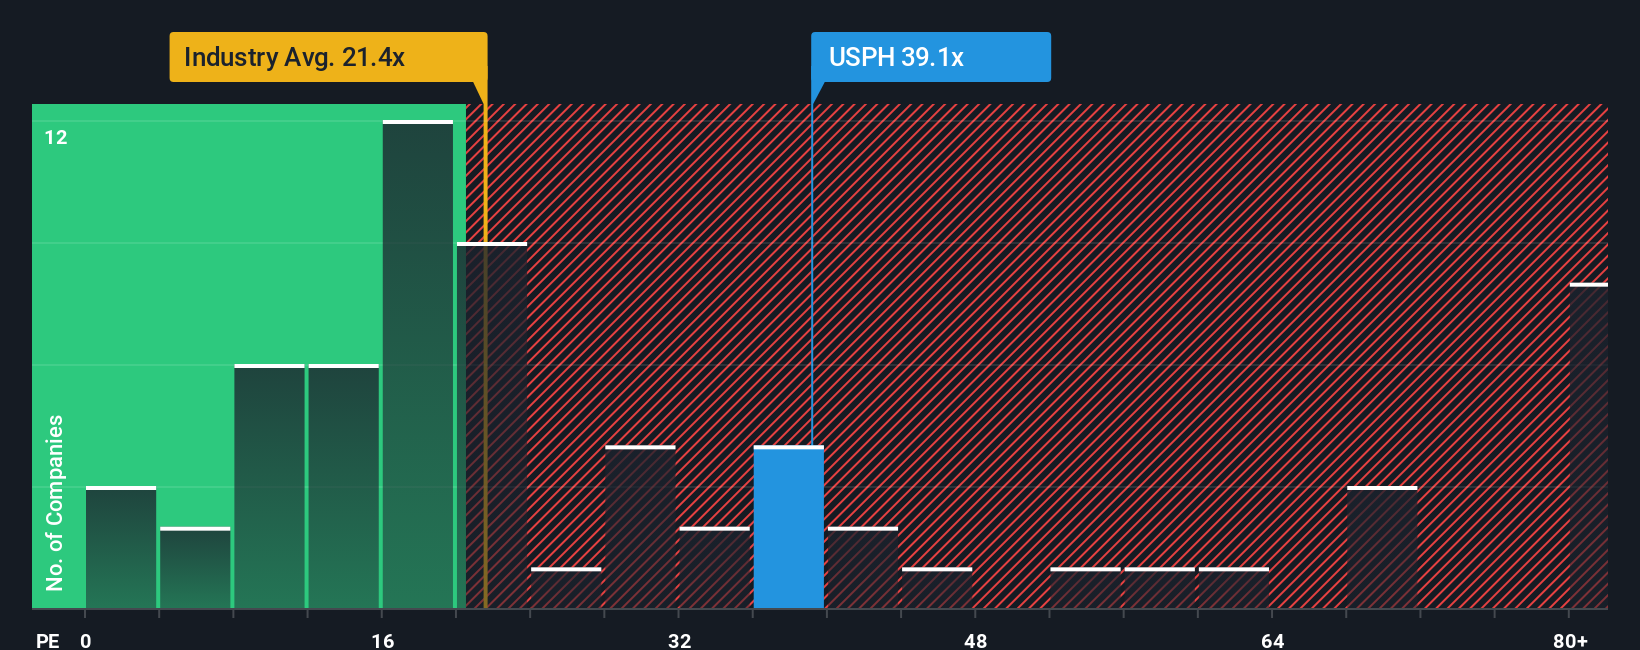
Approach 2: U.S. Physical Therapy Price vs Earnings
For a profitable company like U.S. Physical Therapy, the P/E ratio is a useful way to see how much you are paying for each dollar of earnings. Investors usually accept a higher P/E when they expect stronger growth or see lower risk, and a lower P/E when growth expectations are modest or risks feel higher.
U.S. Physical Therapy currently trades on a P/E of 36.13x. That sits above the Healthcare industry average of 23.18x and the peer average of 15.78x. On the surface, that suggests the market is putting a higher price on the company’s earnings than on many of its listed peers.
Simply Wall St’s Fair Ratio for U.S. Physical Therapy is 18.99x. This is a proprietary estimate of what the P/E might look like after adjusting for factors such as earnings growth, profit margins, industry, market cap, and company specific risks. Because it blends these elements, the Fair Ratio can be a more tailored yardstick than a simple comparison with industry or peer averages. Setting the current P/E of 36.13x against the Fair Ratio of 18.99x points to the shares trading above this customised estimate of fair value.
Result: OVERVALUED
P/E ratios tell one story, but what if the real opportunity lies elsewhere? Start investing in legacies, not executives. Discover our 22 top founder-led companies.
Upgrade Your Decision Making: Choose your U.S. Physical Therapy Narrative
Earlier we mentioned that there is an even better way to understand valuation, so let us introduce you to Narratives, a simple way for you to attach a clear story about U.S. Physical Therapy to the numbers such as your fair value, revenue, earnings, and margin assumptions. A Narrative connects what you believe about the company, like how its clinics might scale or how acquisitions might affect costs, to a financial forecast and then to an estimate of fair value. On Simply Wall St, Narratives live in the Community page and are used by millions of investors, giving you an easy tool to compare your fair value view with the latest share price to help you decide whether the stock looks attractive or expensive to you. These Narratives update automatically when fresh information such as news or earnings is added, so your story and fair value are always linked to current data. For U.S. Physical Therapy, one investor might see a higher fair value based on stronger assumptions for margins while another might use more conservative forecasts and land on a much lower fair value estimate.
Do you think there's more to the story for U.S. Physical Therapy? Head over to our Community to see what others are saying!
This article by Simply Wall St is general in nature. We provide commentary based on historical data and analyst forecasts only using an unbiased methodology and our articles are not intended to be financial advice. It does not constitute a recommendation to buy or sell any stock, and does not take account of your objectives, or your financial situation. We aim to bring you long-term focused analysis driven by fundamental data. Note that our analysis may not factor in the latest price-sensitive company announcements or qualitative material. Simply Wall St has no position in any stocks mentioned.