Is Vertex Pharmaceuticals (VRTX) Pricing Reflect Its DCF Discount And Premium P/E Ratio
Vertex Pharmaceuticals Incorporated VRTX | 438.71 | -1.91% |
- If you are wondering whether Vertex Pharmaceuticals' current share price lines up with its underlying worth, you are not alone.
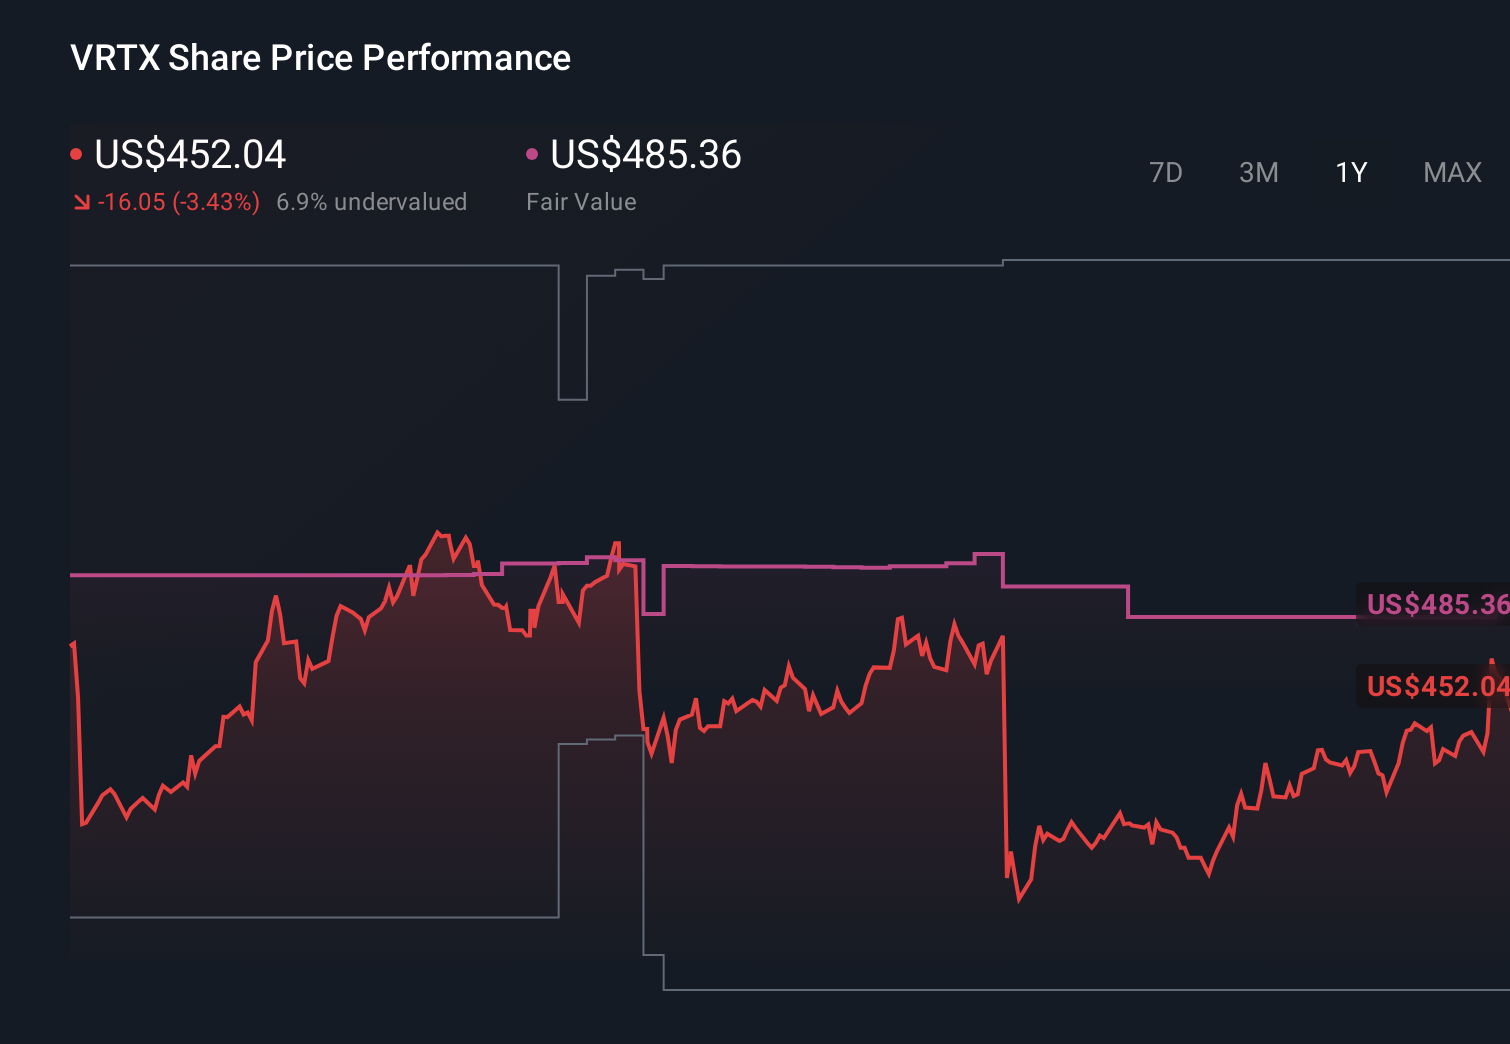
- The stock last closed at US$469.90, with returns of 0.3% over the past week, 3.6% over the past month, 3.9% year to date, 1.8% over one year, 56.1% over three years, and 118.3% over five years, which often prompts questions about how much of the story is already in the price.
- Recent attention around Vertex often focuses on its position in cystic fibrosis treatments and broader pipeline developments. This helps frame how investors think about the current share price and provides useful context as we look at what you are paying for today compared with what the business may deliver over time.
- On Simply Wall St's 6 point valuation framework, Vertex Pharmaceuticals scores 3/6. This suggests a mixed picture that standard valuation models can only partly capture, so we will look at those approaches next and then circle back to a more complete way of thinking about value at the end of the article.
Approach 1: Vertex Pharmaceuticals Discounted Cash Flow (DCF) Analysis
A DCF model takes estimates of a company’s future cash flows and discounts them back to today’s dollars, aiming to translate all those future cash flow amounts into a single present value per share.
For Vertex Pharmaceuticals, the model uses a 2 Stage Free Cash Flow to Equity approach. The latest twelve month free cash flow is about $3.31b. Analysts provide explicit free cash flow estimates out to 2030, for example $4.72b in 2026 and $7.66b in 2030, with further projections beyond that point extrapolated by Simply Wall St using the earlier data as a guide.
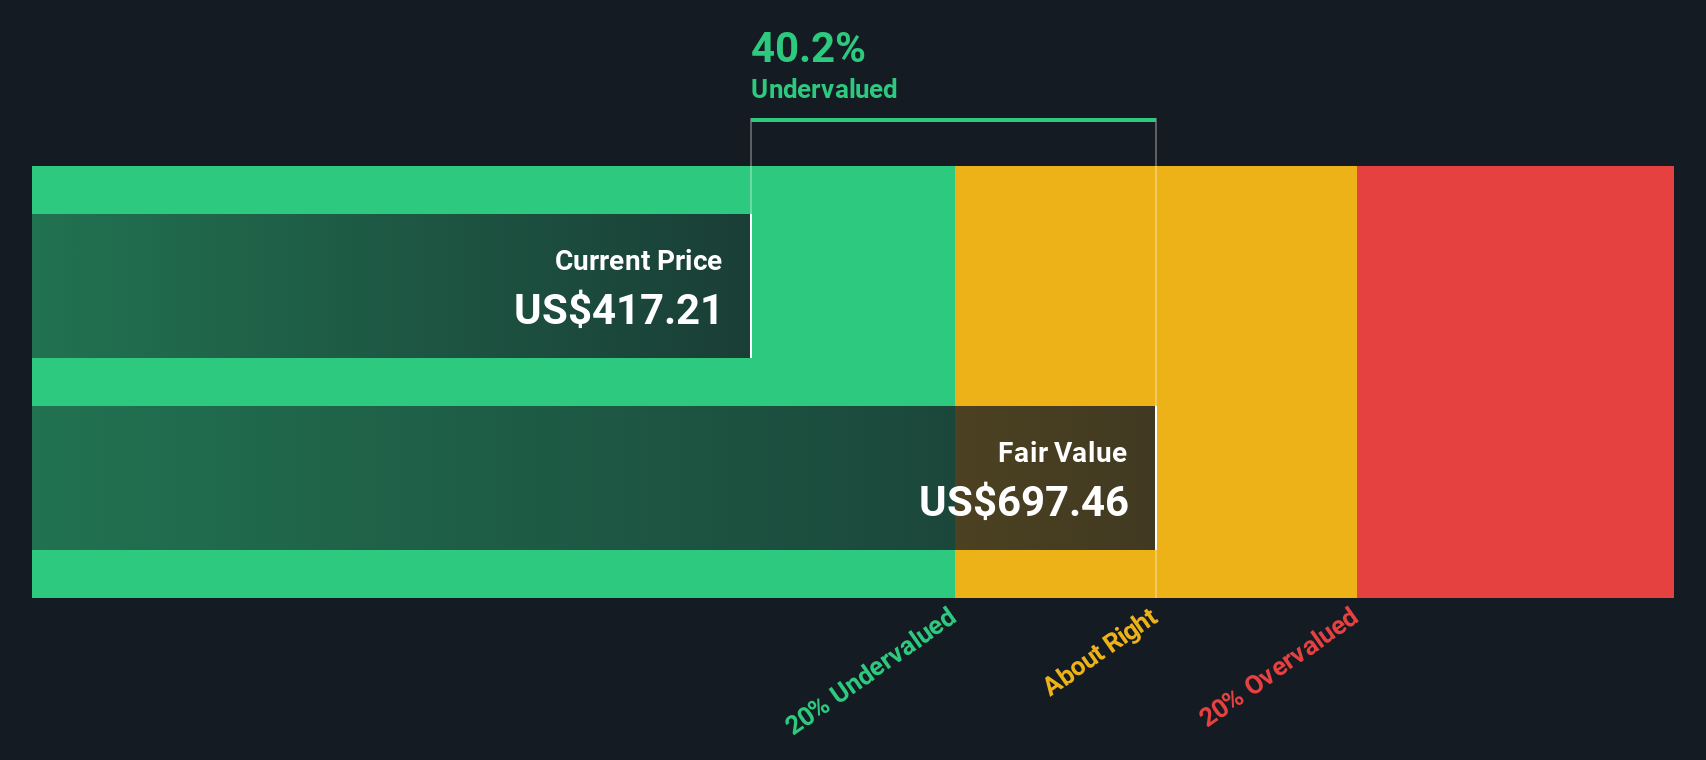
Putting all of those projected cash flows together, and discounting them back to today, produces an estimated intrinsic value of about $736.31 per share. Compared to the recent share price of $469.90, this implies a 36.2% discount, which indicates that the shares are trading below the DCF estimate.
Result: UNDERVALUED
Our Discounted Cash Flow (DCF) analysis suggests Vertex Pharmaceuticals is undervalued by 36.2%. Track this in your watchlist or portfolio, or discover 866 more undervalued stocks based on cash flows.
Approach 2: Vertex Pharmaceuticals Price vs Earnings
For a profitable business like Vertex Pharmaceuticals, the P/E ratio is a useful way to think about what you are paying for each dollar of earnings. Investors usually accept a higher P/E when they expect stronger growth or see lower risk, and a lower P/E when growth expectations are more modest or risks feel higher.
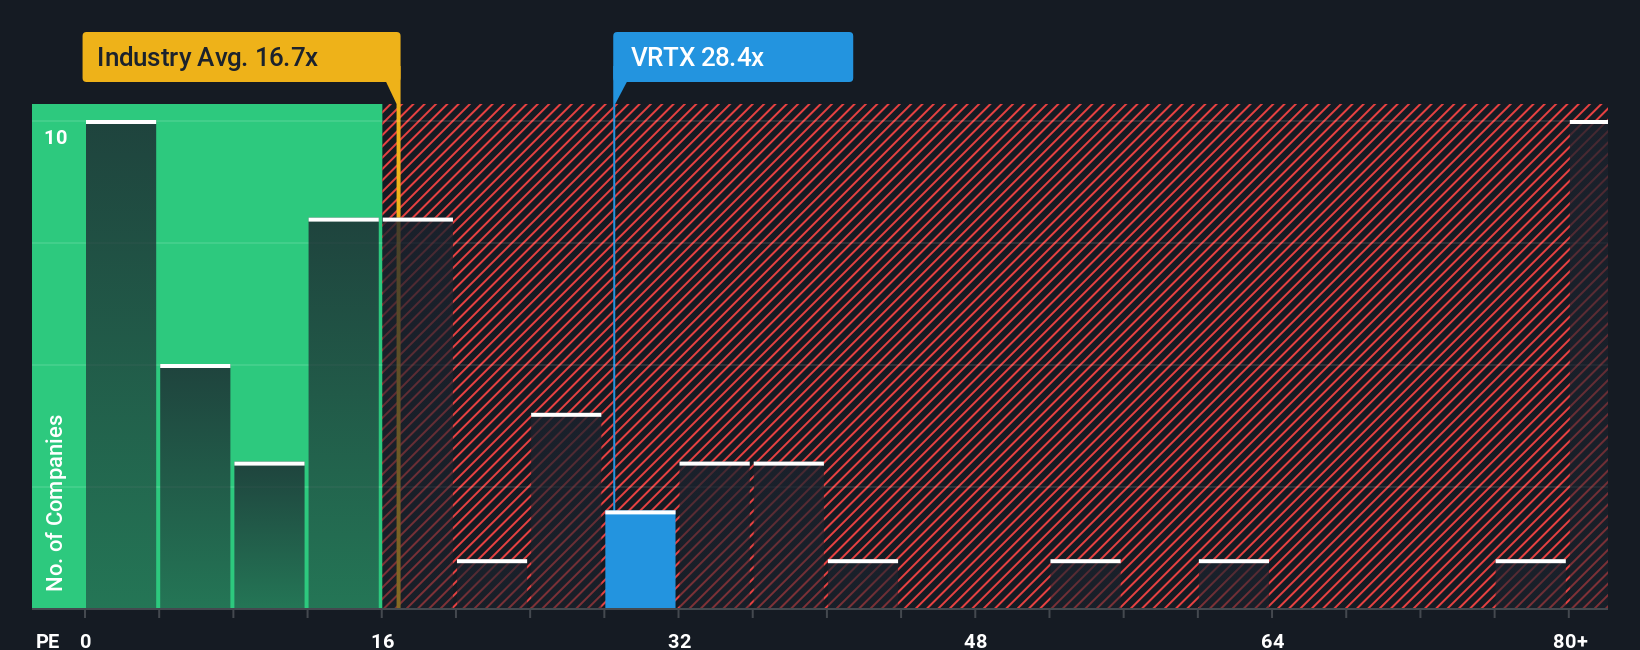
Vertex currently trades on a P/E of 32.44x. That sits above the Biotechs industry average of 20.18x, but below the peer group average of 58.12x, so simple comparisons send mixed signals. To bring more structure to this, Simply Wall St uses a “Fair Ratio”, which is the P/E level that would typically make sense given a company’s earnings growth profile, industry, profit margins, market value and risk factors.
Because the Fair Ratio blends these elements rather than relying only on broad peer or industry comparisons, it can give a more tailored view of what might be reasonable for Vertex. Simply Wall St’s Fair Ratio for Vertex is 29.09x, a little below the current 32.44x, which suggests the shares trade at a premium to that model based view.
Result: OVERVALUED
P/E ratios tell one story, but what if the real opportunity lies elsewhere? Discover 1418 companies where insiders are betting big on explosive growth.
Upgrade Your Decision Making: Choose your Vertex Pharmaceuticals Narrative
Earlier we mentioned that there is an even better way to understand valuation, so let us introduce you to Narratives, which let you attach a clear story to your own assumptions about fair value, future revenue, earnings and margins for Vertex Pharmaceuticals.
A Narrative is simply your view of the company written into numbers, linking what you believe about Vertex’s medicines, pipeline and competitive position to a forecast, and then to a fair value that you can compare with today’s share price.
On Simply Wall St, these Narratives live in the Community page, where millions of investors can quickly build or browse different stories for Vertex, see the fair value those stories produce, and compare that to the current market price to help decide whether they are comfortable buying, holding or selling.
Narratives also refresh as new information like earnings releases, trial updates or major news is incorporated into the underlying forecasts, so your view of Vertex can stay aligned with what is happening rather than relying on a one off model. You might see one investor valuing Vertex at a very cautious fair value, while another assigns a much higher figure based on a more optimistic outlook for its future products.
Do you think there's more to the story for Vertex Pharmaceuticals? Head over to our Community to see what others are saying!
This article by Simply Wall St is general in nature. We provide commentary based on historical data and analyst forecasts only using an unbiased methodology and our articles are not intended to be financial advice. It does not constitute a recommendation to buy or sell any stock, and does not take account of your objectives, or your financial situation. We aim to bring you long-term focused analysis driven by fundamental data. Note that our analysis may not factor in the latest price-sensitive company announcements or qualitative material. Simply Wall St has no position in any stocks mentioned.