Is V.F (VFC) Now At An Interesting Price After Brand And Debt Restructuring News
V.F. Corporation VFC | 16.87 | -0.30% |
- If you are wondering whether V.F at around US$19.68 is a bargain or a value trap, you are not alone. This article will walk through what the current price might be saying about the company.
- The stock has had a mixed run, with a 7 day return of a 5.4% decline and a 30 day return of a 3.0% decline. Year to date it is up 8.4%, but it still shows an 18.1% decline over 1 year and a 70.0% decline over 5 years.
- Recent news coverage around V.F has focused on its brand portfolio, debt load, and efforts to reshape operations. This helps explain why sentiment around the stock has been shifting, and provides context for understanding why the share price has moved differently over shorter and longer timeframes.
- On our valuation checks V.F scores 1 out of 6 for being undervalued. Next we will look at what different valuation methods say about that score, before finishing with a more complete way to think about valuation overall.
V.F scores just 1/6 on our valuation checks. See what other red flags we found in the full valuation breakdown.
Approach 1: V.F Discounted Cash Flow (DCF) Analysis
A Discounted Cash Flow, or DCF, model projects the cash a business could generate in the future and then discounts those cash flows back to what they might be worth in today’s dollars. It is essentially asking what future cash is worth right now.
For V.F, the model used is a 2 Stage Free Cash Flow to Equity approach built on cash flow projections. The latest twelve month free cash flow is about $303.7 million. Analyst estimates and subsequent extrapolations suggest free cash flow of $472.8 million in 2026, $674.7 million by 2028 and $1,030.3 million by 2035. Simply Wall St provides analyst inputs for the earlier years and then extends those forecasts further out.
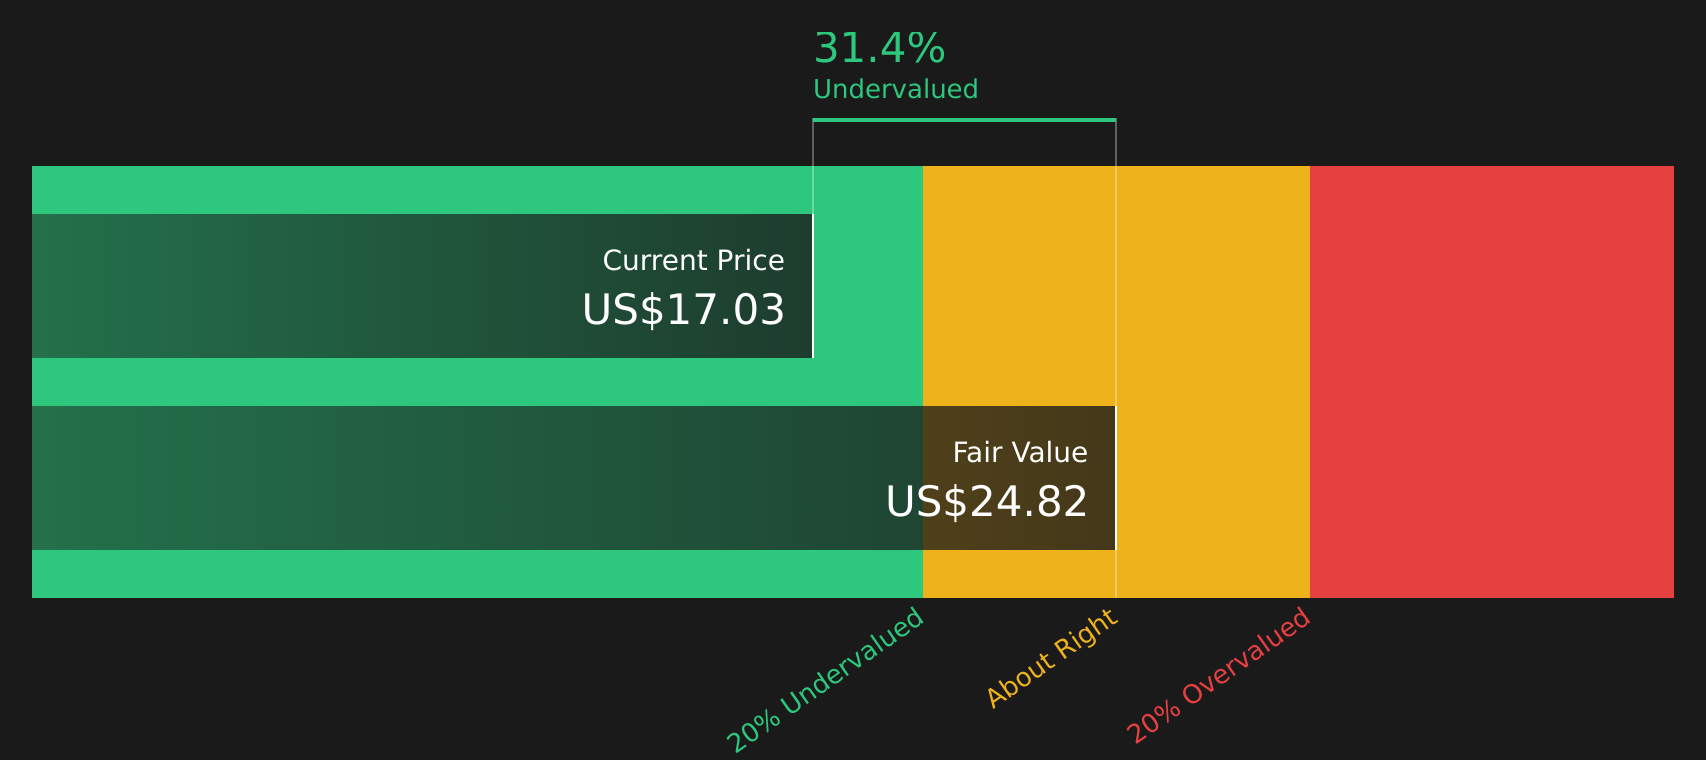
When these projected cash flows are discounted back to today using this model, the estimated intrinsic value comes out at about $24.11 per share. Compared to the recent share price of around $19.68, the DCF indicates an 18.4% discount, which suggests the shares are currently priced below this estimate of fair value.
Result: UNDERVALUED
Our Discounted Cash Flow (DCF) analysis suggests V.F is undervalued by 18.4%. Track this in your watchlist or portfolio, or discover 53 more high quality undervalued stocks.
Approach 2: V.F Price vs Earnings
For a business that is generating profits, the P/E ratio is a common way to think about what you are paying for each dollar of earnings. It connects the share price directly to the company’s current earnings power, which many investors find intuitive when judging whether a stock looks expensive or not.
What counts as a normal or fair P/E will usually reflect how fast earnings are expected to grow and how risky those earnings appear. Higher expected growth or lower perceived risk can justify a higher P/E, while slower growth or higher uncertainty often lines up with a lower P/E.
V.F currently trades on a P/E of 34.39x. That sits above the Luxury industry average of 20.76x and above the peer average of 15.72x. Simply Wall St’s Fair Ratio for V.F is 25.05x. This is its own estimate of an appropriate P/E once factors like earnings growth, industry, profit margins, market cap and company specific risks are combined into a single number.
This Fair Ratio can be more informative than a simple comparison with peers or the industry because it aims to adjust for differences in growth, risk and profitability, rather than assuming all companies should trade on the same multiple. With V.F’s current P/E of 34.39x sitting above the Fair Ratio of 25.05x, the multiple based view points to the shares looking expensive relative to that Fair Ratio.
Result: OVERVALUED

P/E ratios tell one story, but what if the real opportunity lies elsewhere? Start investing in legacies, not executives. Discover our 19 top founder-led companies.
Upgrade Your Decision Making: Choose your V.F Narrative
Earlier we mentioned that there is an even better way to understand valuation. Narratives on Simply Wall St give you a simple way to attach a story to the numbers by linking your view of V.F’s brands, revenue, earnings and margins to a financial forecast, a Fair Value, and a clear comparison with the current share price. All of this is available within an accessible tool on the Community page that updates automatically when new news or earnings arrive. You can see, for example, how one V.F Narrative might lean cautious with a Fair Value around US$14.00, while another assumes a stronger outcome with a Fair Value near US$31.44. You can then decide which story best matches your own expectations and how that lines up with today’s market price.
For V.F however, we’ll make it really easy for you with previews of two leading V.F Narratives:
Fair Value in this bullish narrative: US$31.44 per share
Implied discount to this Fair Value at the recent price of US$19.68: about 37% lower than the narrative Fair Value
Revenue growth assumption: 3.35% a year
- Analysts in this bullish camp see cost transformation, digital focused distribution and operational changes supporting higher margins and a stronger earnings profile into 2028.
- They expect brands such as The North Face and Timberland to support growth, with revenue, profit margins and a future P/E of 20.8x combining to underpin a Fair Value comfortably above the current share price.
- To agree with this view you would need to be comfortable with earnings rising to about US$721.2m by 2028 and the market still valuing V.F on a P/E above the current Luxury industry level.
Fair Value in this cautious narrative: US$14.00 per share
Implied premium to this Fair Value at the recent price of US$19.68: about 41% higher than the narrative Fair Value
Revenue growth assumption: 0.53% decline a year
- Analysts in this cautious camp focus on structural pressure on legacy brands, softer demand and ongoing margin headwinds that could limit earnings power despite cost savings plans.
- Their Fair Value leans on more muted revenue assumptions, lower profitability and a future P/E of 19.40x, which together point to a value below the current share price.
- To agree with this view you would need to assume revenues of about US$9.1b, earnings of roughly US$439.2m in 2028 and a lower valuation multiple than bullish analysts are using.
These two Narratives give you a clear range for what different analysts think V.F might be worth and what has to happen on revenue, margins and P/E for each case to make sense. Once you know which story feels closer to your own expectations, you can then decide how the current price of US$19.68 fits with that view.
Do you think there's more to the story for V.F? Head over to our Community to see what others are saying!

This article by Simply Wall St is general in nature. We provide commentary based on historical data and analyst forecasts only using an unbiased methodology and our articles are not intended to be financial advice. It does not constitute a recommendation to buy or sell any stock, and does not take account of your objectives, or your financial situation. We aim to bring you long-term focused analysis driven by fundamental data. Note that our analysis may not factor in the latest price-sensitive company announcements or qualitative material. Simply Wall St has no position in any stocks mentioned.