Is V.F (VFC) Now Fairly Priced After Years Of Share Price Declines?
V.F. Corporation VFC | 16.87 | -0.30% |
- If you are wondering whether V.F at around US$19.74 is a bargain or a value trap, you are not alone. This article walks through what the current price might be implying.
- The share price has moved 4.9% over the last 7 days and 7.6% over the last 30 days. The longer term picture includes an 8.7% year to date return alongside a 23.3% 1 year decline, a 28.9% 3 year decline and a 69.6% 5 year decline.
- These mixed returns sit against a backdrop of ongoing news flow around the broader apparel and footwear space, including investor attention on how brands are managing consumer demand and costs. For V.F, that context helps explain why the market has been reassessing both the risks around the business and the price it is prepared to pay for the stock.
- Simply Wall St's valuation model currently gives V.F a value score of 1 out of 6. Next we will look at how different valuation methods arrive at this kind of result, before finishing with a view on a more rounded way to think about what the shares might be worth.
V.F scores just 1/6 on our valuation checks. See what other red flags we found in the full valuation breakdown.
Approach 1: V.F Discounted Cash Flow (DCF) Analysis
A Discounted Cash Flow, or DCF, model estimates what a company might be worth by projecting its future cash flows and then discounting those back to today’s value. In this case, V.F is assessed using a 2 Stage Free Cash Flow to Equity model, which looks at near term forecasts and then extends them further out.
V.F’s latest twelve month free cash flow is around $208.1 million. Analysts have provided free cash flow estimates for the next few years, and Simply Wall St then extends those projections further. By 2028, the model uses a forecast free cash flow of about $641.2 million, with additional estimates running out to 2035, all expressed in $ and discounted back to today using a required rate of return.
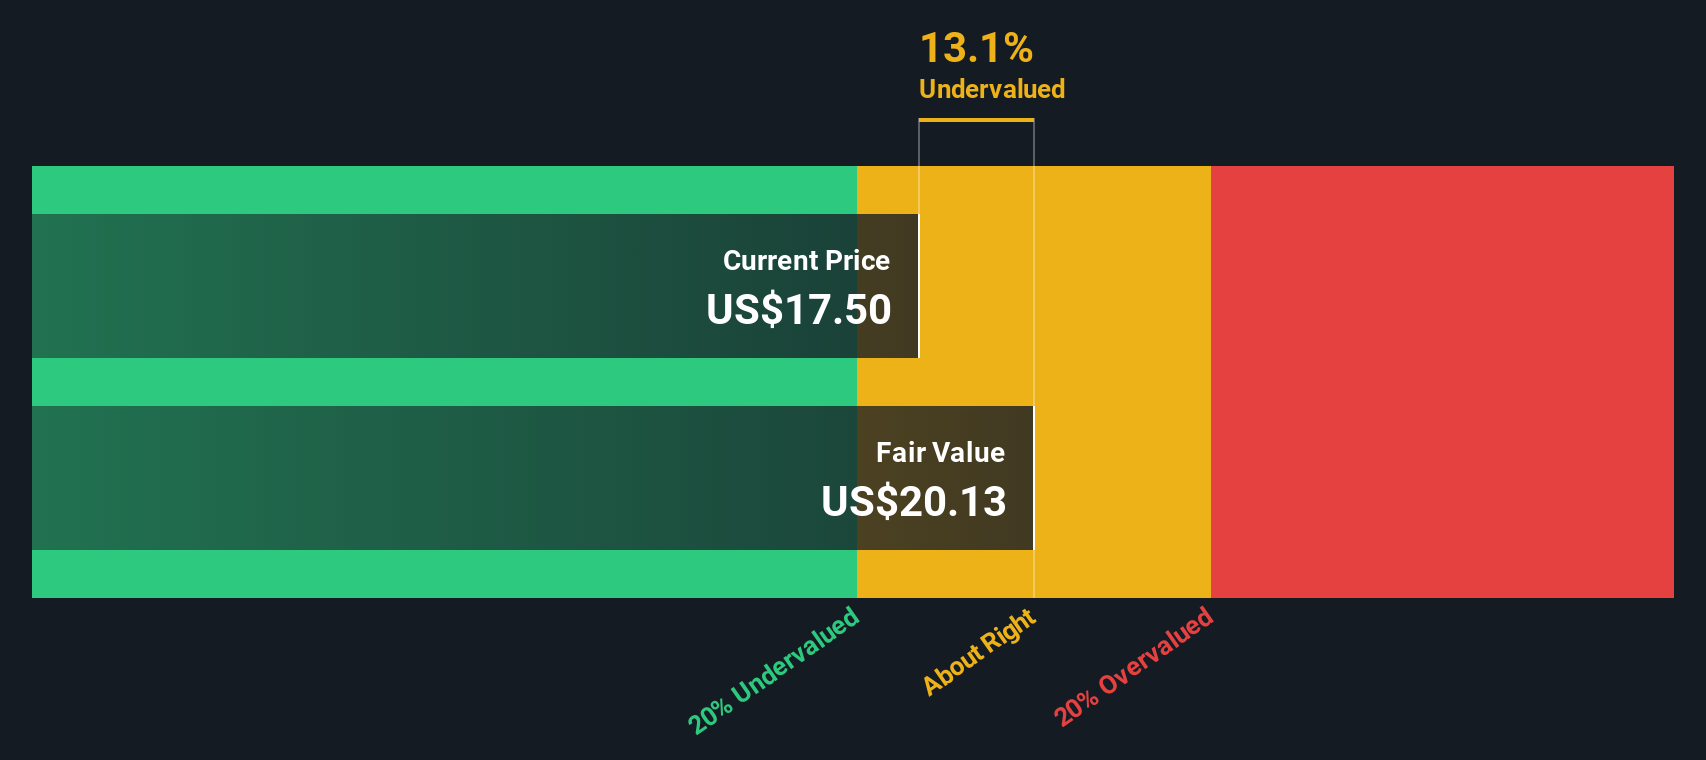
When all those discounted cash flows are added together, the model arrives at an estimated intrinsic value of about $20.58 per share. Compared with a recent share price of roughly $19.74, the DCF output suggests the shares trade at about a 4.1% discount, which is a small gap.
Result: ABOUT RIGHT
V.F is fairly valued according to our Discounted Cash Flow (DCF), but this can change at a moment's notice. Track the value in your watchlist or portfolio and be alerted on when to act.
Approach 2: V.F Price vs Earnings
For companies that are generating profits, the P/E ratio is a useful way to think about what you are paying for each dollar of earnings. It lets you compare different businesses on a common footing, using the earnings they produce today as the anchor.
In general, investors tend to accept a higher or lower P/E depending on what they expect for future growth and how risky they think those earnings are. Higher expected growth or lower perceived risk can support a higher P/E, while slower growth or higher risk usually means a lower P/E looks more reasonable.
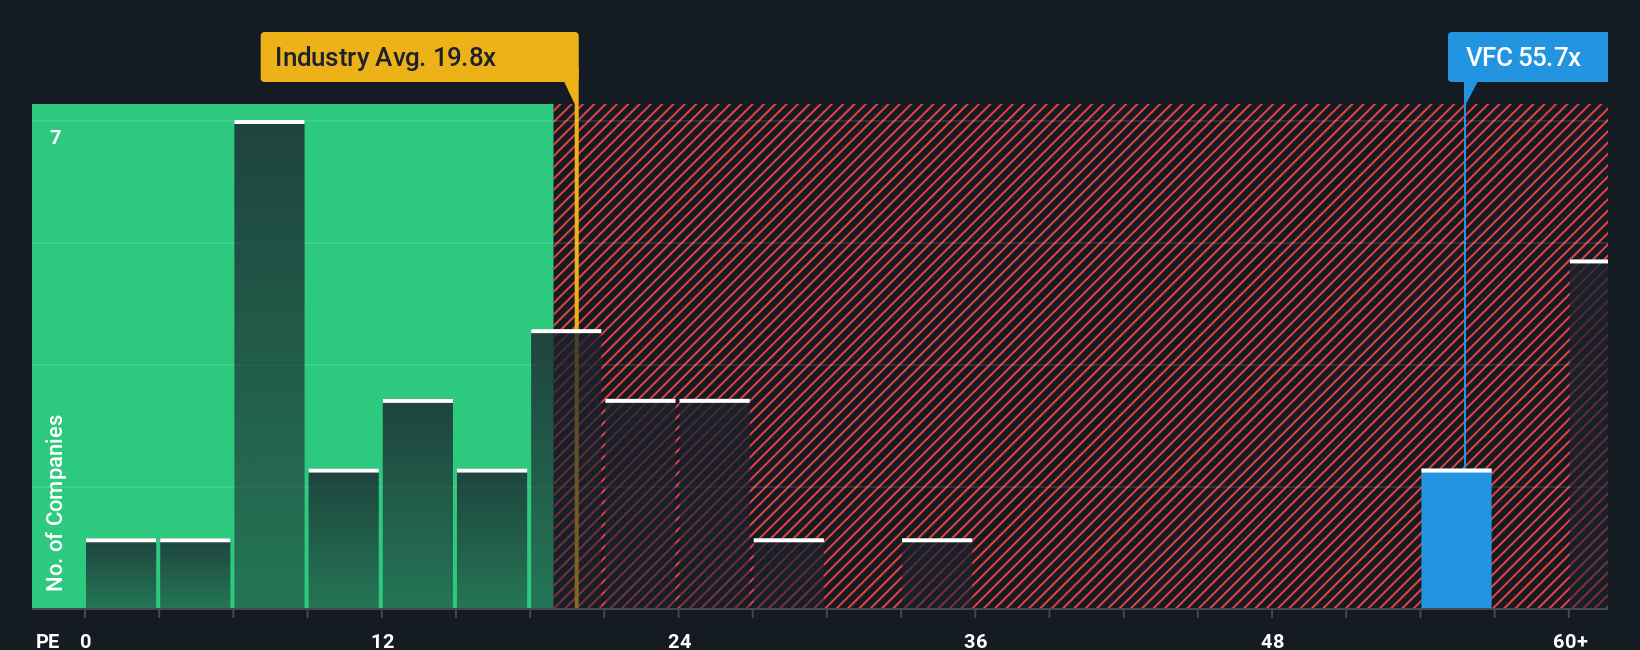
V.F currently trades on a P/E of about 83.65x. That sits well above the Luxury industry average of about 19.70x and the peer group average of roughly 13.54x. Simply Wall St also calculates a proprietary “Fair Ratio” of around 29.47x. This is the P/E it would expect for V.F after considering factors such as its earnings growth profile, profitability, industry, market cap and company specific risks.
This Fair Ratio is more tailored than a simple comparison to peers or the industry because it adjusts for those business specific drivers rather than assuming all companies deserve similar multiples. Set against that Fair Ratio of 29.47x, V.F’s current P/E of 83.65x screens as meaningfully higher, which points to the shares looking expensive on this metric.
Result: OVERVALUED
P/E ratios tell one story, but what if the real opportunity lies elsewhere? Discover 1428 companies where insiders are betting big on explosive growth.
Upgrade Your Decision Making: Choose your V.F Narrative
Earlier we mentioned that there is an even better way to understand valuation, so let us introduce you to Narratives, which are simply your story about a company, linked to your own assumptions for future revenue, earnings, margins and a fair value per share.
Instead of only looking at ratios like P/E, a Narrative ties V.F’s business story to a financial forecast and then to a fair value. This allows you to clearly see how your view of the brand, its products and its risks translates into numbers.
You can build and explore Narratives on Simply Wall St’s Community page, where millions of investors share different takes. The platform then compares each Narrative’s Fair Value to the current share price to help you decide whether V.F looks worth further research or whether you might wait.
Narratives are kept up to date as new information such as company news or earnings is added to the platform. For V.F you might see one investor with a higher fair value based on stronger margin assumptions and another with a lower fair value based on more cautious revenue forecasts, both clearly mapped out against today’s price.
Do you think there's more to the story for V.F? Head over to our Community to see what others are saying!

This article by Simply Wall St is general in nature. We provide commentary based on historical data and analyst forecasts only using an unbiased methodology and our articles are not intended to be financial advice. It does not constitute a recommendation to buy or sell any stock, and does not take account of your objectives, or your financial situation. We aim to bring you long-term focused analysis driven by fundamental data. Note that our analysis may not factor in the latest price-sensitive company announcements or qualitative material. Simply Wall St has no position in any stocks mentioned.