Is VICI Properties (VICI) Pricing Look Attractive After Recent Steady Return Profile?
VICI Properties Inc VICI | 0.00 |
- Wondering if VICI Properties is offering fair value at today's price, or if the stock is quietly setting up a better entry point, starts with understanding how its current market price compares with its fundamentals.
- The stock last closed at US$28.65, with returns of 0.2% over the past week, 3.6% over the past month, 1.8% year to date, 4.1% over three years and a 4.0% decline over the last year.
- Recent coverage around VICI has focused on its role as a major owner of experiential real estate and how that positioning fits into investor demand for income-focused REITs. This context helps explain why the stock has moved less dramatically than many growth focused sectors, even as interest rate expectations and risk appetite shift.
- On Simply Wall St's 6 point valuation checklist, VICI scores a 5/6 valuation score. This invites a closer look at how metrics like DCF, P/E and P/B compare with peers, and why there may be an even more complete way to think about value by the end of this article.
Approach 1: VICI Properties Discounted Cash Flow (DCF) Analysis
A Discounted Cash Flow (DCF) model estimates what a stock could be worth by projecting its future adjusted funds from operations, then discounting those cash flows back to today in dollar terms.
For VICI Properties, the model uses a two-stage Free Cash Flow to Equity approach based on adjusted funds from operations. The latest twelve month free cash flow is about $2.53b. Analyst estimates and subsequent extrapolations point to projected free cash flow of $3.82b in 2035, with interim years such as 2028 at $2.92b. Simply Wall St provides analyst inputs for the nearer years and then extends those projections further out.
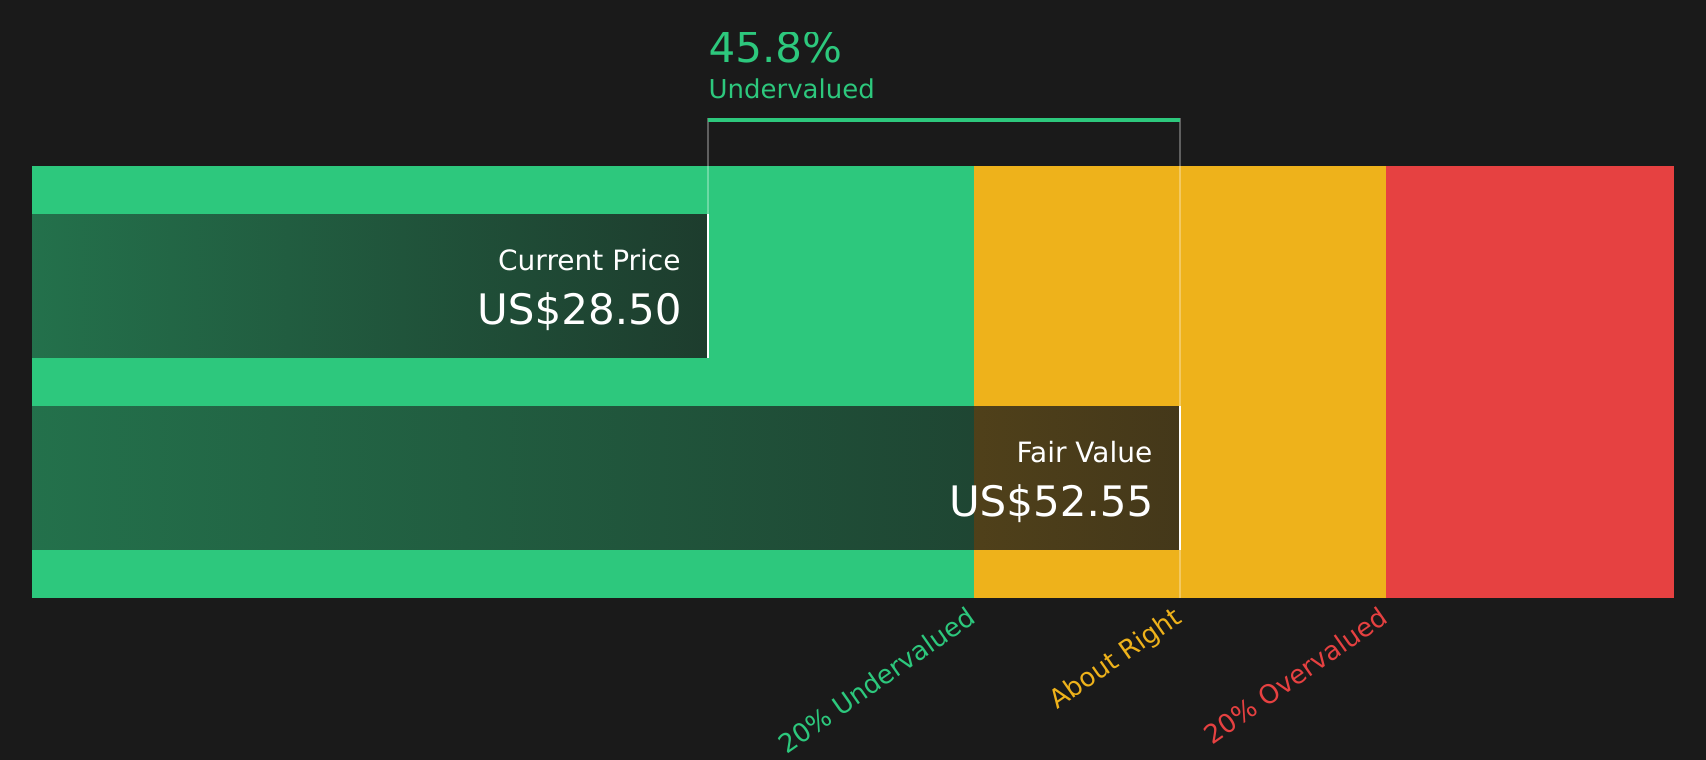
When all those projected cash flows are discounted back, the model arrives at an estimated intrinsic value of US$53.42 per share. Compared with the recent share price of US$28.65, this implies an intrinsic discount of 46.4%, which indicates the stock is undervalued according to this specific DCF framework.
Result: UNDERVALUED
Our Discounted Cash Flow (DCF) analysis suggests VICI Properties is undervalued by 46.4%. Track this in your watchlist or portfolio, or discover 44 more high quality undervalued stocks.
Approach 2: VICI Properties Price vs Earnings
For profitable companies, the P/E ratio is a useful way to connect what you are paying for each share with the earnings the company is currently generating. It gives a quick sense of how much investors are willing to pay today for each dollar of earnings.
What counts as a "normal" P/E usually reflects expectations for future growth and the risks around those earnings. Higher expected growth or lower perceived risk tends to support a higher P/E, while slower growth or higher uncertainty often aligns with a lower multiple.
VICI Properties trades on a P/E of 9.87x, compared with the Specialized REITs industry average of 16.34x and a peer average of 56.04x. Simply Wall St also calculates a proprietary Fair Ratio for VICI of 32.15x. This Fair Ratio estimates the P/E that could be reasonable for the company based on factors such as its earnings growth profile, profit margins, industry, market value and specific risks.
Because the Fair Ratio adjusts for these company specific factors, it can be more informative than a simple comparison with peers or the broad industry. With VICI's current P/E of 9.87x sitting well below the Fair Ratio of 32.15x, the stock appears undervalued on this metric.
Result: UNDERVALUED

P/E ratios tell one story, but what if the real opportunity lies elsewhere? Start investing in legacies, not executives. Discover our 19 top founder-led companies.
Upgrade Your Decision Making: Choose your VICI Properties Narrative
Earlier the article mentioned that there is an even better way to understand valuation. Narratives are introduced here as your way of attaching a clear story about VICI Properties to the numbers. They link what you believe about its Caesars lease exposure, experiential real estate opportunity and funding risks to a financial forecast and a fair value that you can compare with the current price. All of this sits within the Simply Wall St Community page, where Narratives are easy to set up, update automatically when new news or earnings arrive, and can differ meaningfully between investors. For example, one Narrative might lean toward the higher US$39.0 analyst target, with stronger assumptions about experiential demand and new partnerships. Another might sit closer to the US$29.0 low target, with more weight on tenant concentration and online gaming risk. This gives you a clear, numbers based view of how your perspective translates into a personal fair value that can help inform when you might want to buy or sell.
Do you think there's more to the story for VICI Properties? Head over to our Community to see what others are saying!

This article by Simply Wall St is general in nature. We provide commentary based on historical data and analyst forecasts only using an unbiased methodology and our articles are not intended to be financial advice. It does not constitute a recommendation to buy or sell any stock, and does not take account of your objectives, or your financial situation. We aim to bring you long-term focused analysis driven by fundamental data. Note that our analysis may not factor in the latest price-sensitive company announcements or qualitative material. Simply Wall St has no position in any stocks mentioned.