Is Walker & Dunlop (WD) Pricing Reflect Recent Commercial Real Estate Headwinds?
Walker & Dunlop, Inc. WD | 48.21 | +0.75% |
- If you are wondering whether Walker & Dunlop is fairly priced or offering value right now, you are not alone. The stock’s current level has many investors reassessing what they are willing to pay.
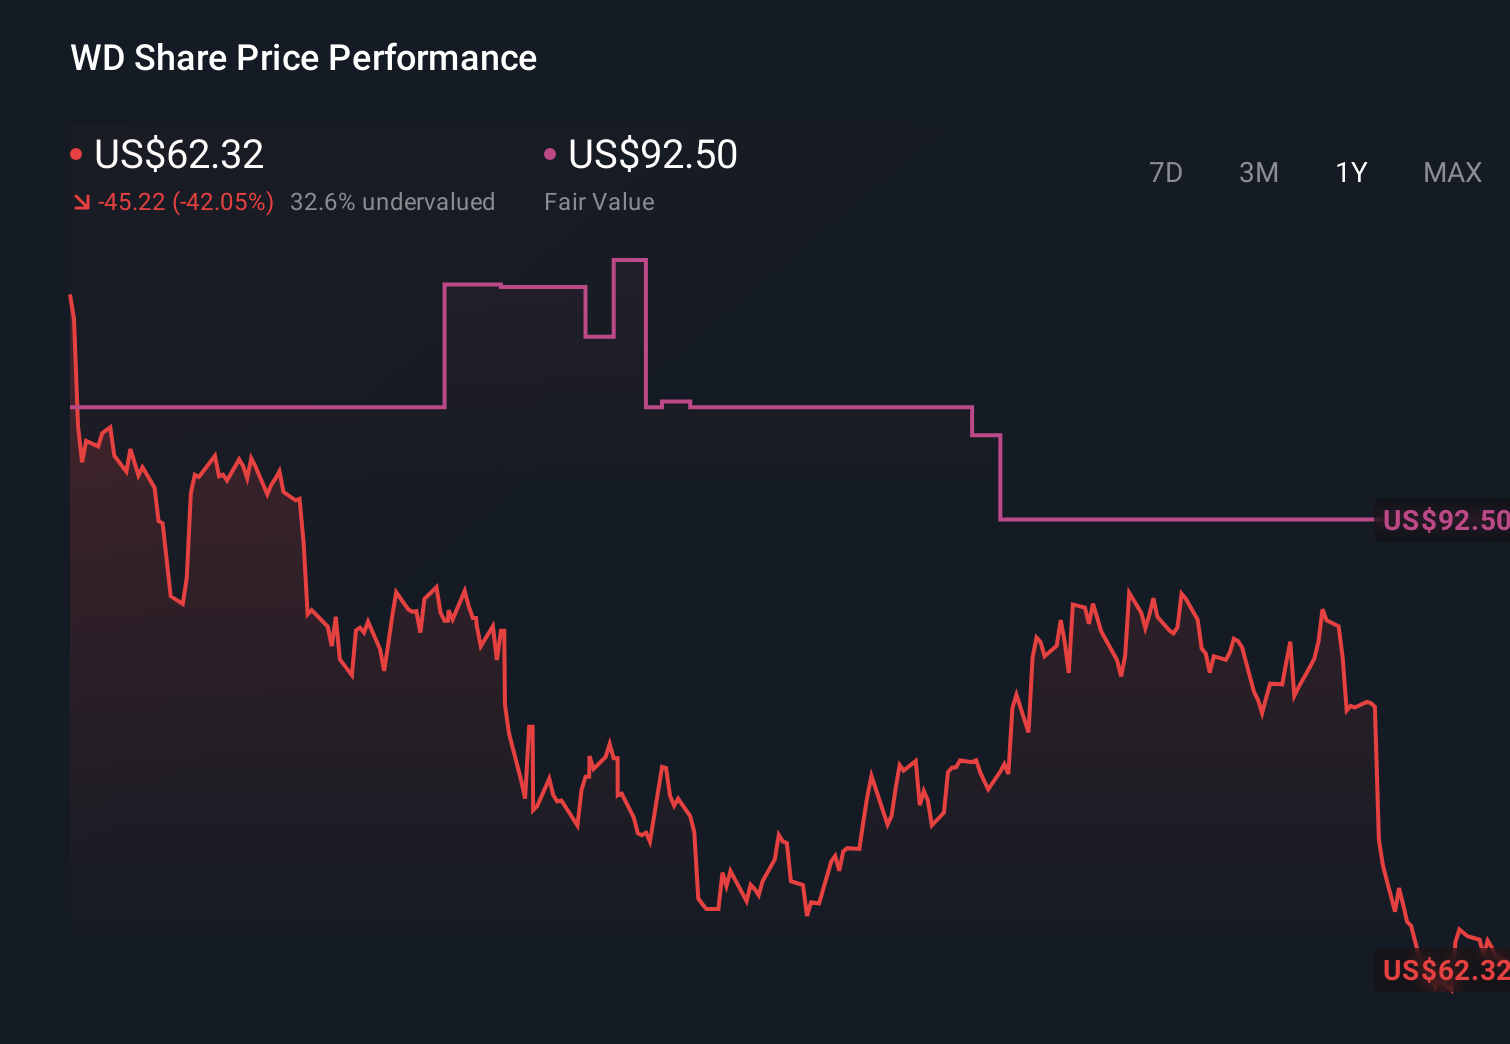
- The share price recently closed at US$61.86, with returns of a 2.2% decline over 7 days, a 4.3% decline over 30 days, a 5.3% gain year to date, and a 25.8% decline over 1 year, as well as a 26.6% decline over 3 years and a 31.3% decline over 5 years.
- Recent attention on Walker & Dunlop has been driven by ongoing updates around the commercial real estate and financing industry, as investors weigh how funding conditions and transaction volumes affect intermediaries and service providers. Broader sector headlines about capital markets activity, refinancing trends and credit conditions have provided context for the share price moves you are seeing.
- Simply Wall St’s valuation model currently gives Walker & Dunlop a value score of 1 out of 6. Next we will look at how traditional methods like DCF, P/E and asset based approaches line up with that score, and then finish with a more holistic way to think about what the stock might be worth.
Walker & Dunlop scores just 1/6 on our valuation checks. See what other red flags we found in the full valuation breakdown.
Approach 1: Walker & Dunlop Excess Returns Analysis
The Excess Returns model looks at how much profit a company can earn on its equity above the return that shareholders require, then turns that stream of “excess” profit into an intrinsic value per share.
For Walker & Dunlop, the model uses a Book Value of US$52.89 per share and a Stable EPS of US$3.19 per share, based on the median return on equity over the past 5 years. The Stable Book Value input is US$51.95 per share, taken from the median book value over the same period.
The required return for shareholders, or Cost of Equity, is set at US$3.81 per share. Against this, the model calculates an Excess Return of US$0.62 per share in the negative direction, alongside an Average Return on Equity of 6.14%. That negative excess figure is what drives the model’s relatively conservative output.
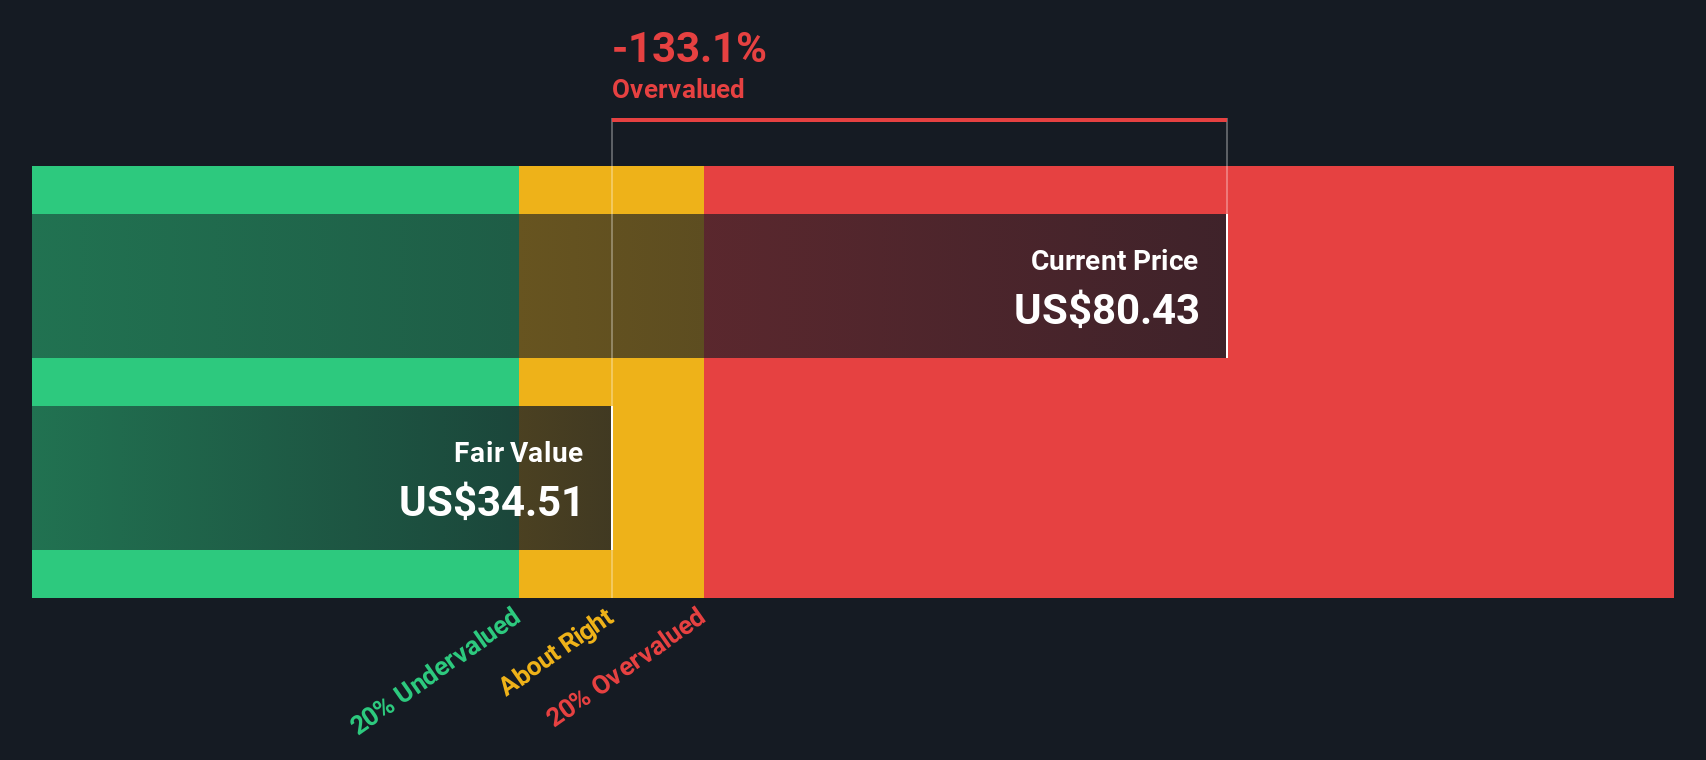
Putting this together, the Excess Returns framework arrives at an intrinsic value estimate of about US$36.12 per share. This output suggests the stock is around 71.2% overvalued relative to the recent price of US$61.86.
Result: OVERVALUED
Our Excess Returns analysis suggests Walker & Dunlop may be overvalued by 71.2%. Discover 53 high quality undervalued stocks or create your own screener to find better value opportunities.
Approach 2: Walker & Dunlop Price vs Earnings
For a profitable company, the P/E ratio is a straightforward way to think about what you are paying for each dollar of earnings. It ties the share price directly to the bottom line, which is usually the anchor for most equity valuations.
What counts as a “normal” P/E depends on what investors expect for future growth and how much risk they see in those earnings. Higher expected growth or lower perceived risk can support a higher P/E, while lower growth or higher risk usually means investors are only willing to pay a lower multiple.
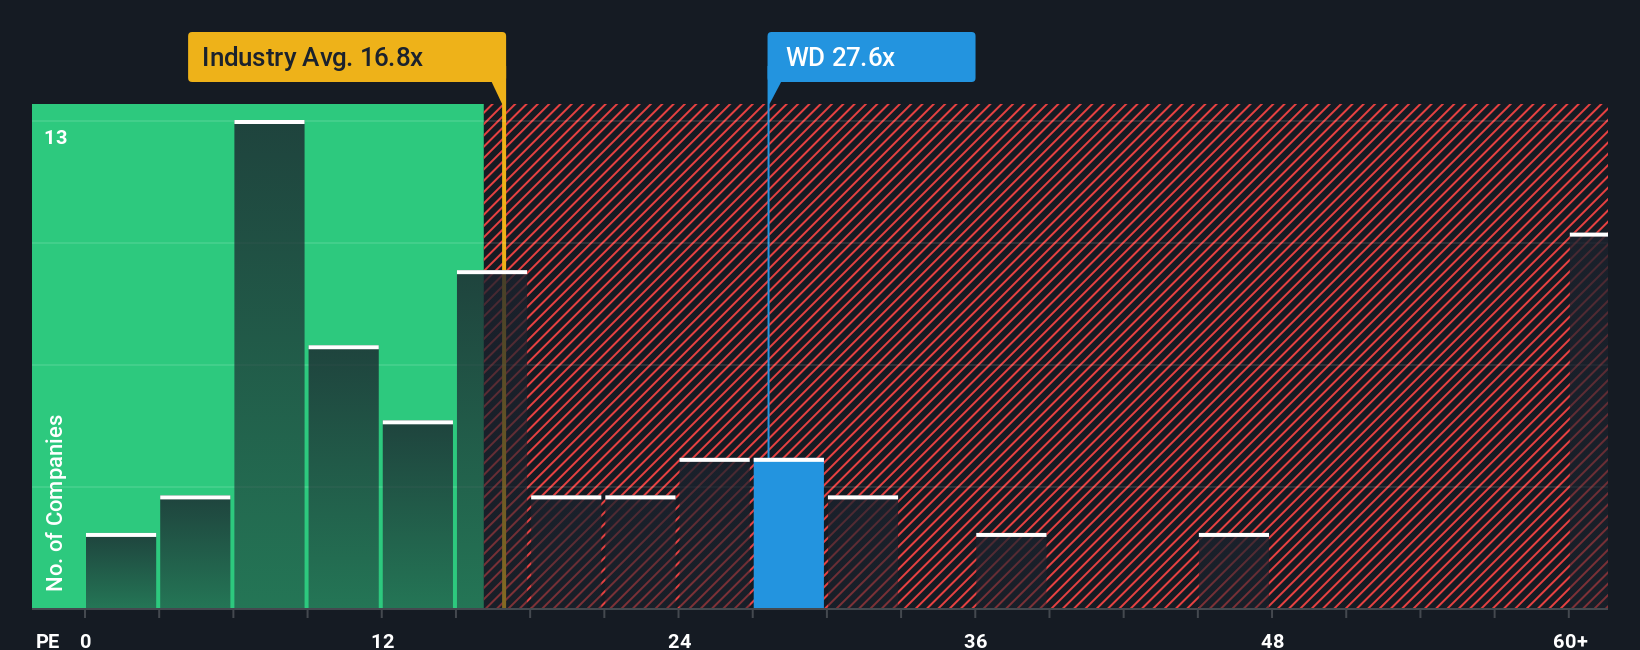
Walker & Dunlop currently trades on a P/E of 18.76x. That sits above both the Diversified Financial industry average of 16.02x and the peer group average of 9.51x. Simply Wall St’s Fair Ratio for Walker & Dunlop is 16.04x. This is their proprietary view of what the P/E might be given factors such as earnings profile, industry, profit margins, market cap and risk characteristics. This Fair Ratio goes a step beyond simple peer or industry comparisons because it adjusts for those company specific drivers rather than assuming one size fits all. With the actual P/E above the 16.04x Fair Ratio, the shares screen as trading on a richer multiple than that model implies.
Result: OVERVALUED
P/E ratios tell one story, but what if the real opportunity lies elsewhere? Start investing in legacies, not executives. Discover our 23 top founder-led companies.
Upgrade Your Decision Making: Choose your Walker & Dunlop Narrative
Earlier we mentioned that there is an even better way to understand valuation. Let us introduce you to Narratives, which are simply your story about Walker & Dunlop written in numbers like your fair value, revenue, earnings and margin estimates. These are then linked to a financial forecast and fair value that you can compare to the current share price on Simply Wall St’s Community page, where millions of investors share views. When new information such as earnings or company news is added, those Narratives refresh automatically. You can then see, for example, how one investor might build a more optimistic Walker & Dunlop story closer to the US$92.50 analyst target or the US$83.33 fair value estimate, while another might plug in more cautious assumptions, leading to a lower fair value and a very different view on whether the current price looks attractive or not.
Do you think there's more to the story for Walker & Dunlop? Head over to our Community to see what others are saying!
This article by Simply Wall St is general in nature. We provide commentary based on historical data and analyst forecasts only using an unbiased methodology and our articles are not intended to be financial advice. It does not constitute a recommendation to buy or sell any stock, and does not take account of your objectives, or your financial situation. We aim to bring you long-term focused analysis driven by fundamental data. Note that our analysis may not factor in the latest price-sensitive company announcements or qualitative material. Simply Wall St has no position in any stocks mentioned.