Is Webull (BULL) Pricing Looked At Differently After A 52% One Month Share Price Jump
Bull Run Corp BULL | 0.00 |
- If you are wondering whether Webull's current share price still leaves room for value or if most of the opportunity is already reflected in the stock, this article breaks down what the numbers indicate.
- Webull closed at US$7.33 most recently, with a 3.2% return over the last 7 days, a 52.1% return over 30 days, a 10.5% decline year to date, and a 50.9% decline over the past year.
- Those moves have come as Webull continues to attract attention from investors who watch trading platforms closely and who are reassessing risk and reward across the sector. Recent coverage has focused on how sentiment can shift quickly in this space and what that might mean for trading activity and user engagement.
- On Simply Wall St's valuation checks, Webull scores 2 out of 6. Next up is a closer look at what different valuation methods suggest about that score and a deeper framework later in the article that can help you judge value more confidently.
Webull scores just 2/6 on our valuation checks. See what other red flags we found in the full valuation breakdown.
Approach 1: Webull Discounted Cash Flow (DCF) Analysis
A Discounted Cash Flow, or DCF, model looks at the cash Webull is expected to generate in the future and then discounts those cash flows back to today to estimate what the stock might be worth right now.
For Webull, the model used is a 2 Stage Free Cash Flow to Equity approach that starts from last twelve months free cash flow of about $561.4 million. Simply Wall St then projects free cash flows out to 2035, using analyst estimates where available and extending them beyond the typical 5 year window. By 2035, the model is using an extrapolated free cash flow figure of about $946.6 million, with each future year discounted back to today using a required rate of return.
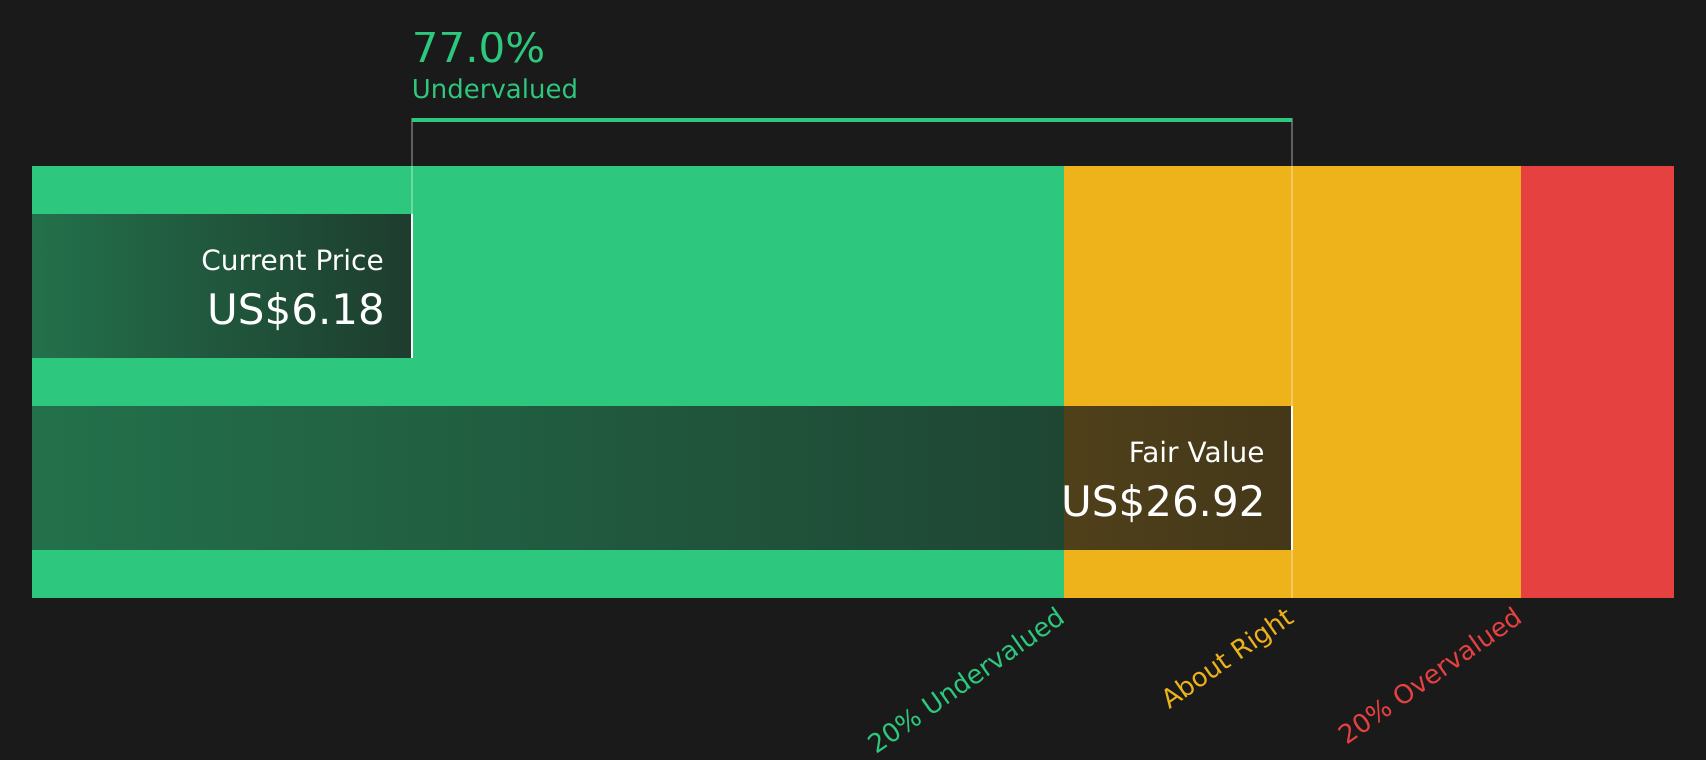
Pulling those discounted cash flows together gives an estimated intrinsic value of US$29.30 per share. Compared with the recent share price of US$7.33, the DCF output suggests Webull is about 75.0% undervalued on this model.
Result: UNDERVALUED
Our Discounted Cash Flow (DCF) analysis suggests Webull is undervalued by 75.0%. Track this in your watchlist or portfolio, or discover 51 more high quality undervalued stocks.
Approach 2: Webull Price vs Sales
For many profitable and revenue generating companies, the P/S ratio is a useful way to compare what investors are paying for each dollar of sales, especially when earnings can be affected by non cash items or recent investments.
In general, higher growth expectations and lower perceived risk can support a higher P/S ratio, while slower growth and higher risk usually point to a lower, more conservative multiple. The question is what looks reasonable for Webull given how similar companies are priced.
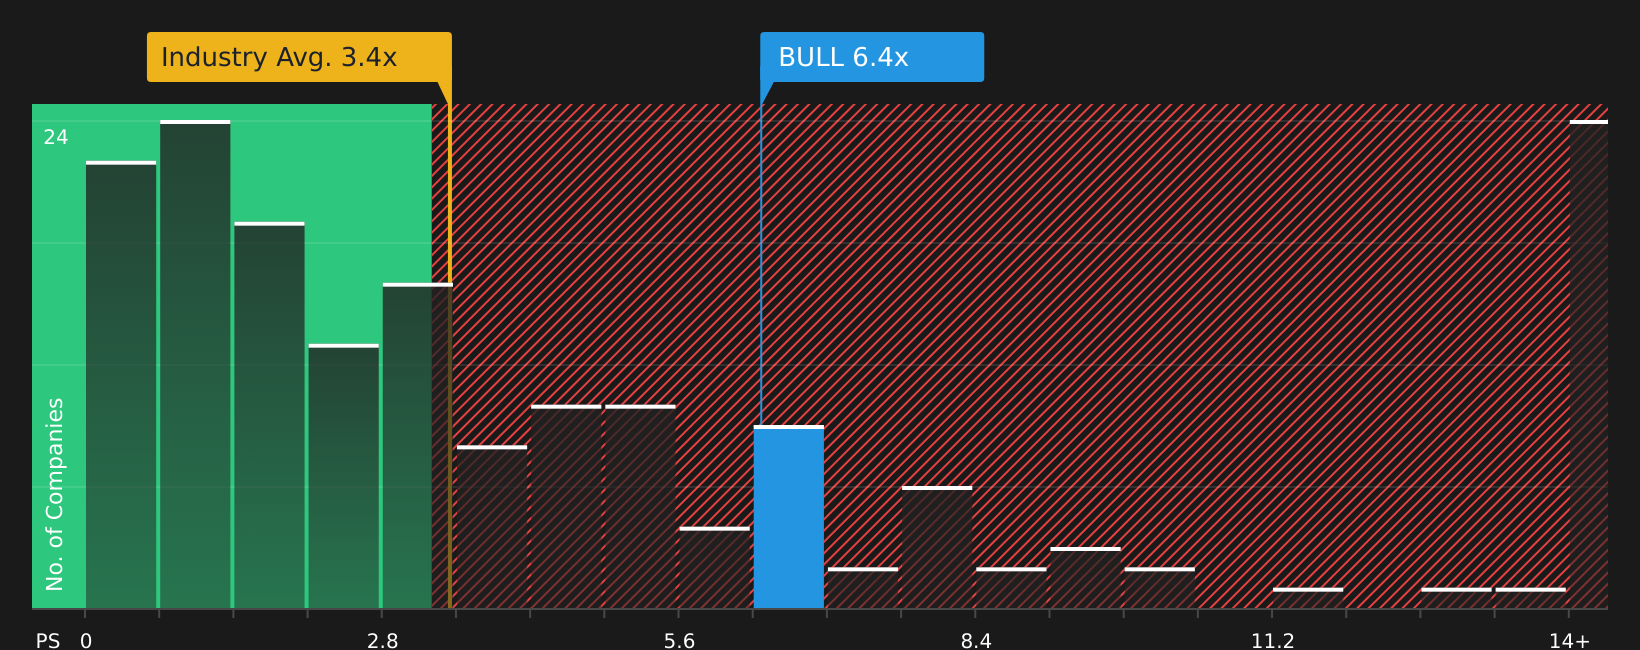
Webull currently trades on a P/S ratio of about 7.05x. That is above the Capital Markets industry average P/S of about 3.56x and also above the peer group average of about 1.71x. Simply Wall St’s Fair Ratio for Webull is 3.30x, which is its proprietary estimate of an appropriate P/S multiple after factoring in elements such as the company’s earnings growth profile, profit margins, size, industry and key risks.
Because the Fair Ratio is tailored to Webull’s fundamentals rather than just broad sector or peer comparisons, it can provide a more company specific anchor for valuation. On this measure, Webull’s current 7.05x P/S is well above the Fair Ratio of 3.30x, which indicates the stock may be overvalued on this metric.
Result: OVERVALUED
P/S ratios tell one story, but what if the real opportunity lies elsewhere? Start investing in legacies, not executives. Discover our 19 top founder-led companies.
Upgrade Your Decision Making: Choose your Webull Narrative
Earlier it was mentioned that there is an even better way to understand valuation. Narratives bring that idea to life by letting you attach a clear story, your view on Webull, to the numbers you see on fair value, revenue, earnings and margins, so that your forecast and your price estimate are tied to what you actually believe about the business.
On Simply Wall St, Narratives live inside the Community page and are used by millions of investors as an accessible tool where you can see how a company’s story connects to a financial forecast and then flows through to a fair value that you can compare directly with today’s share price to help guide your own buy or sell decisions.
Because Narratives update when new information arrives, such as earnings or news, your view does not stay fixed. You can quickly see how a more cautious Webull Narrative, closer to a US$9.00 fair value, differs from a more optimistic one, closer to US$14.00, and decide which story and set of assumptions feels more realistic for you.
Do you think there's more to the story for Webull? Head over to our Community to see what others are saying!

This article by Simply Wall St is general in nature. We provide commentary based on historical data and analyst forecasts only using an unbiased methodology and our articles are not intended to be financial advice. It does not constitute a recommendation to buy or sell any stock, and does not take account of your objectives, or your financial situation. We aim to bring you long-term focused analysis driven by fundamental data. Note that our analysis may not factor in the latest price-sensitive company announcements or qualitative material. Simply Wall St has no position in any stocks mentioned.