Is XPeng (NYSE:XPEV) Offering Value After Recent Share Price Pullback?
XPENG INC. XPEV | 17.70 | +1.09% |
- If you are looking at XPeng and wondering whether the current share price gives you good value, you are not alone. That is exactly what this article will unpack.
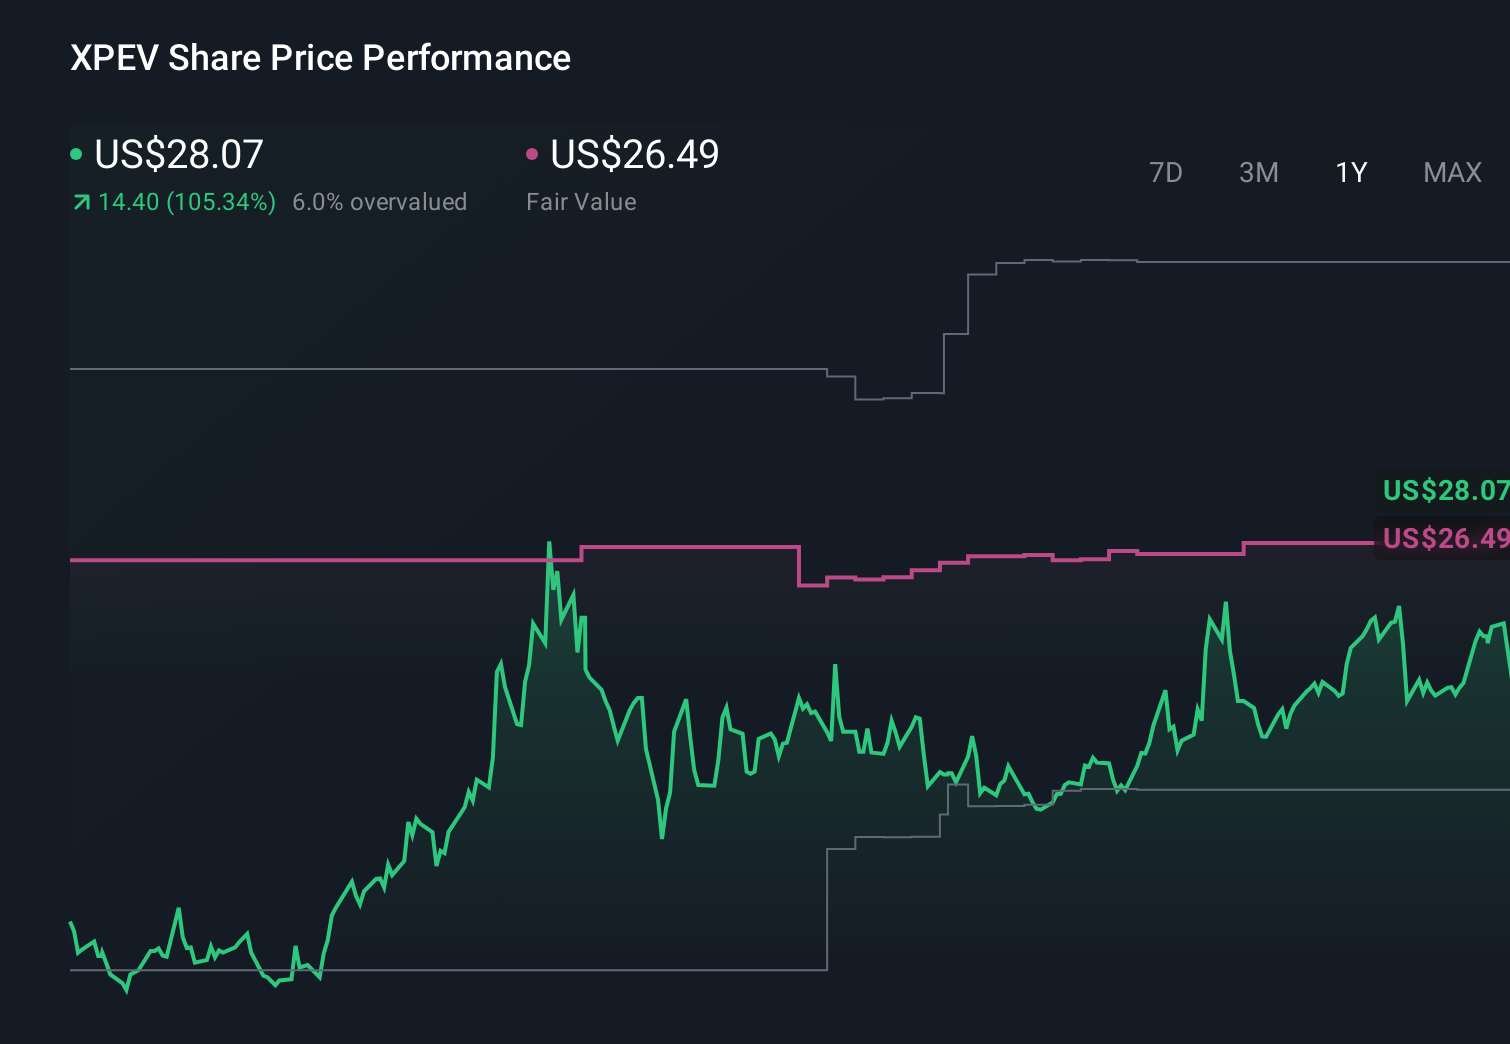
- The stock last closed at US$18.57, with returns of 22.9% over 1 year but declines of 7.1% over 7 days, 10.6% over 30 days and 9.1% year to date. This points to shifting expectations around its prospects and risk.
- Recent coverage has focused on XPeng's position in the electric vehicle space, alongside ongoing attention on competitive pressure within the sector and changing sentiment toward growth oriented carmakers. This context helps explain why the share price has seen gains over 1 year but pressure over the shorter term as investors reassess how much they are willing to pay.
- XPeng currently has a valuation score of 3 out of 6. This means it screens as undervalued on half of the checks we use. Next we will break down the different valuation approaches behind that result and then finish with a way to look at valuation that can give you an even clearer picture.
Approach 1: XPeng Discounted Cash Flow (DCF) Analysis
A Discounted Cash Flow, or DCF, model looks at the cash XPeng is expected to generate in the future, then discounts those projections back to what they might be worth today.
XPeng’s latest twelve month free cash flow is a loss of CN¥5,106.31m, so the model leans heavily on future estimates. Analysts provide forecasts out to 2027, with Simply Wall St extending those out to 2035 using a 2 Stage Free Cash Flow to Equity approach. For example, projected free cash flow for 2026 is CN¥8,219.23m and for 2027 it is CN¥10,497.50m, with further years extrapolated from these inputs.
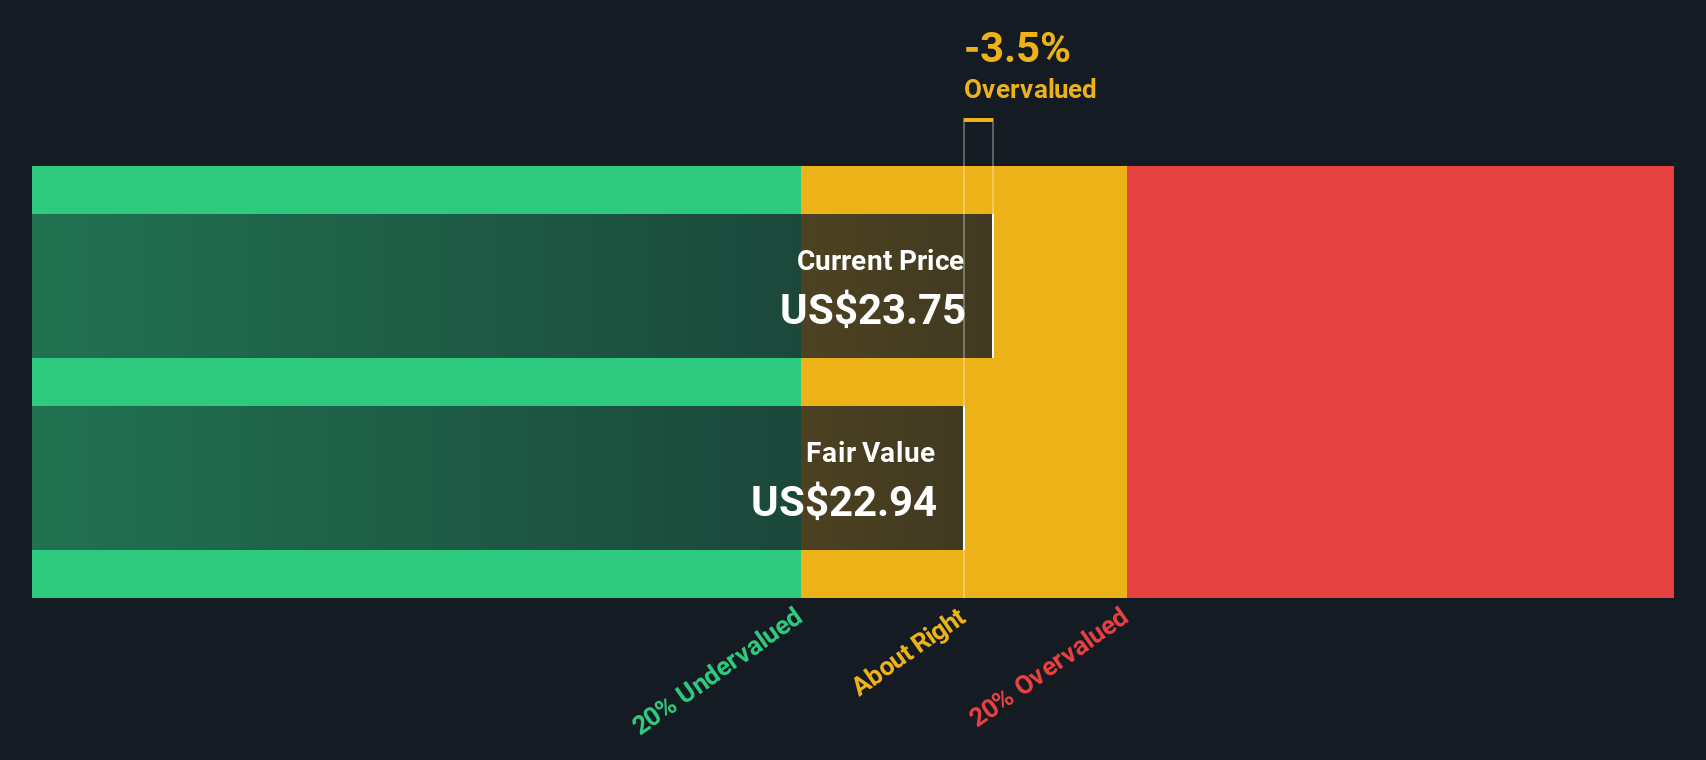
After discounting these projected cash flows in CN¥ back to today, the model arrives at an estimated intrinsic value of US$24.86 per share. Compared with the recent share price of US$18.57, this implies the stock screens as 25.3% undervalued under this set of assumptions.
Result: UNDERVALUED
Our Discounted Cash Flow (DCF) analysis suggests XPeng is undervalued by 25.3%. Track this in your watchlist or portfolio, or discover 876 more undervalued stocks based on cash flows.
Approach 2: XPeng Price vs Sales
For companies where profits are limited or volatile, the P/S ratio is often more useful than P/E because it compares the share price to revenue rather than earnings. It still reflects what investors are willing to pay for each unit of sales, which is influenced by expectations for future growth and the risks around achieving it.
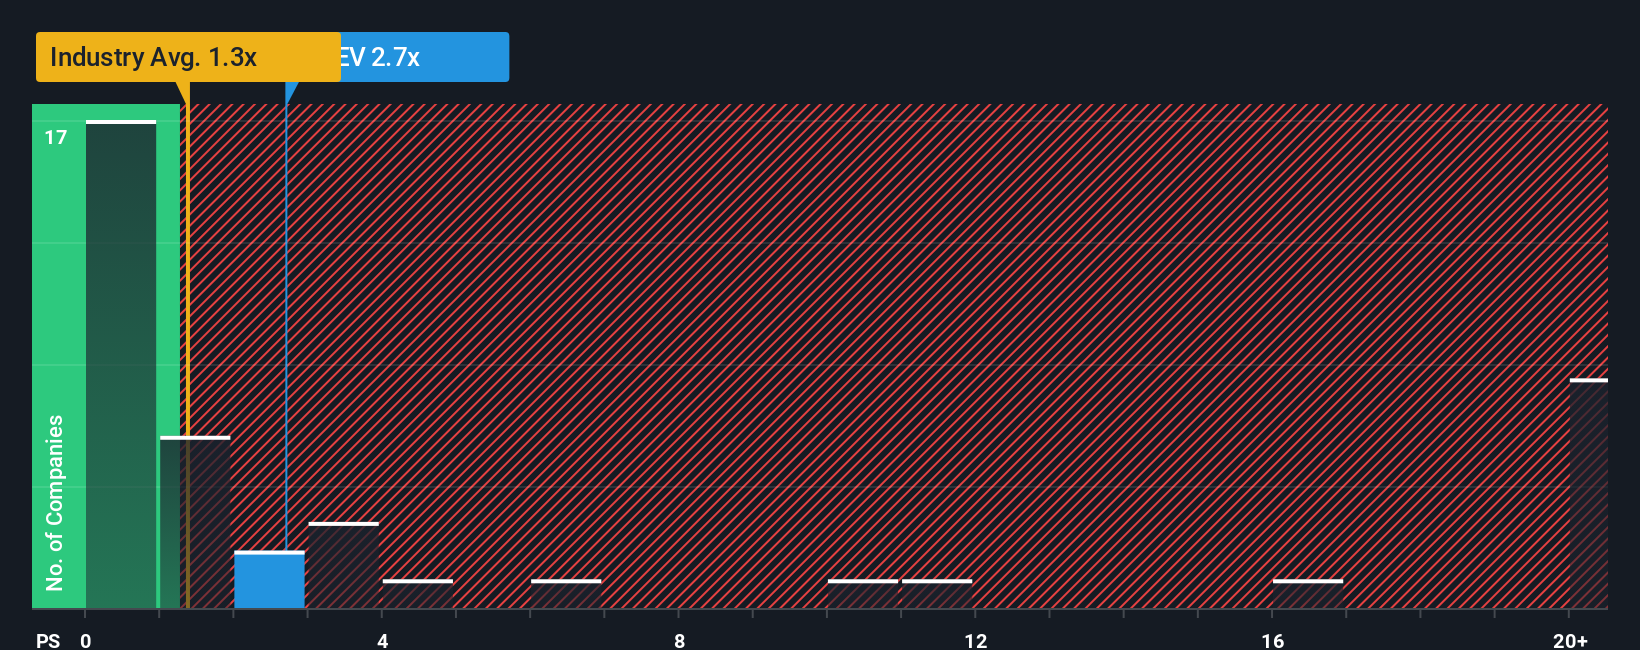
XPeng currently trades on a P/S of 1.75x. That sits above the Auto industry average P/S of 0.73x and below the peer group average of 2.07x, so the market is pricing XPeng’s sales somewhere between the broader sector and closer peers. Simply Wall St also calculates a Fair Ratio of 1.53x for XPeng’s P/S. This is a proprietary estimate of what a reasonable multiple could be after factoring in elements like earnings growth, profit margins, market cap, industry and stock specific risks, rather than just comparing against a simple sector or peer average.
Since XPeng’s actual P/S of 1.75x is higher than the Fair Ratio of 1.53x by more than 0.10, the shares screen as slightly expensive on this measure.
Result: OVERVALUED
P/S ratios tell one story, but what if the real opportunity lies elsewhere? Discover 1422 companies where insiders are betting big on explosive growth.
Upgrade Your Decision Making: Choose your XPeng Narrative
Earlier we mentioned that there is an even better way to understand valuation, so let us introduce you to Narratives, a simple way to connect your view of XPeng’s story with the numbers behind it.
A Narrative is your own storyline for the company, where you spell out what you think could happen to its revenue, earnings and margins, then tie that to an assumed fair value instead of relying only on bare ratios or someone else’s model.
On Simply Wall St, Narratives sit inside the Community page and guide you from story to forecast to fair value. They then help you compare that fair value to the current share price so you can decide whether XPeng looks attractive, fully priced or expensive on your terms.
These Narratives update automatically when new information such as news or earnings is added to the platform, so your view of XPeng’s value can stay aligned with the latest data rather than a static one off estimate.
For example, one XPeng Narrative on the Community page might assume a much higher fair value while another assumes a far lower fair value, and those differences reflect how two investors can look at the same company and reach very different conclusions.
Do you think there's more to the story for XPeng? Head over to our Community to see what others are saying!
This article by Simply Wall St is general in nature. We provide commentary based on historical data and analyst forecasts only using an unbiased methodology and our articles are not intended to be financial advice. It does not constitute a recommendation to buy or sell any stock, and does not take account of your objectives, or your financial situation. We aim to bring you long-term focused analysis driven by fundamental data. Note that our analysis may not factor in the latest price-sensitive company announcements or qualitative material. Simply Wall St has no position in any stocks mentioned.