Is XPO’s (XPO) LTL Service Gains Quietly Redrawing Its Competitive Positioning Narrative?
XPO, Inc. XPO | 0.00 |
- In the first quarter of 2026, Carillon Tower Advisers highlighted XPO, Inc.’s strong less‑than‑truckload performance and improved service levels, even as freight conditions remained difficult.
- This recognition underscored how XPO’s operational execution is helping narrow its service and pricing gap with a leading peer, which may influence how investors view its longer-term prospects.
- Next, we’ll examine how this operational improvement spotlight fits with XPO’s existing investment narrative around technology, margins, and network quality.
Invest in the nuclear renaissance through our list of 91 elite nuclear energy infrastructure plays powering the global AI revolution.
XPO Investment Narrative Recap
To own XPO, you need to believe its less than truckload network, technology and service quality can justify a premium valuation despite freight cyclicality and high debt. Carillon Tower Advisers’ recent praise for XPO’s execution supports the near term catalyst around margin improvement, but it does not materially change the key risk that a weak freight cycle and cost inflation could still pressure earnings and returns.
Among recent developments, the most relevant to this spotlight on operations is XPO’s upcoming Q1 2026 earnings release on April 30. With 2025 net income of US$316,000,000 and profit margins lower than the prior year, the next set of results will be a key check on whether operational gains and technology investments are translating into the kind of earnings and margin trajectory that could support its elevated P/E and justify continued buybacks.
Yet beneath this improving service picture, investors should be aware of how prolonged freight softness and elevated labor costs could…
XPO's narrative projects $9.7 billion revenue and $754.5 million earnings by 2029. This requires 5.8% yearly revenue growth and about a $438.5 million earnings increase from $316.0 million today.
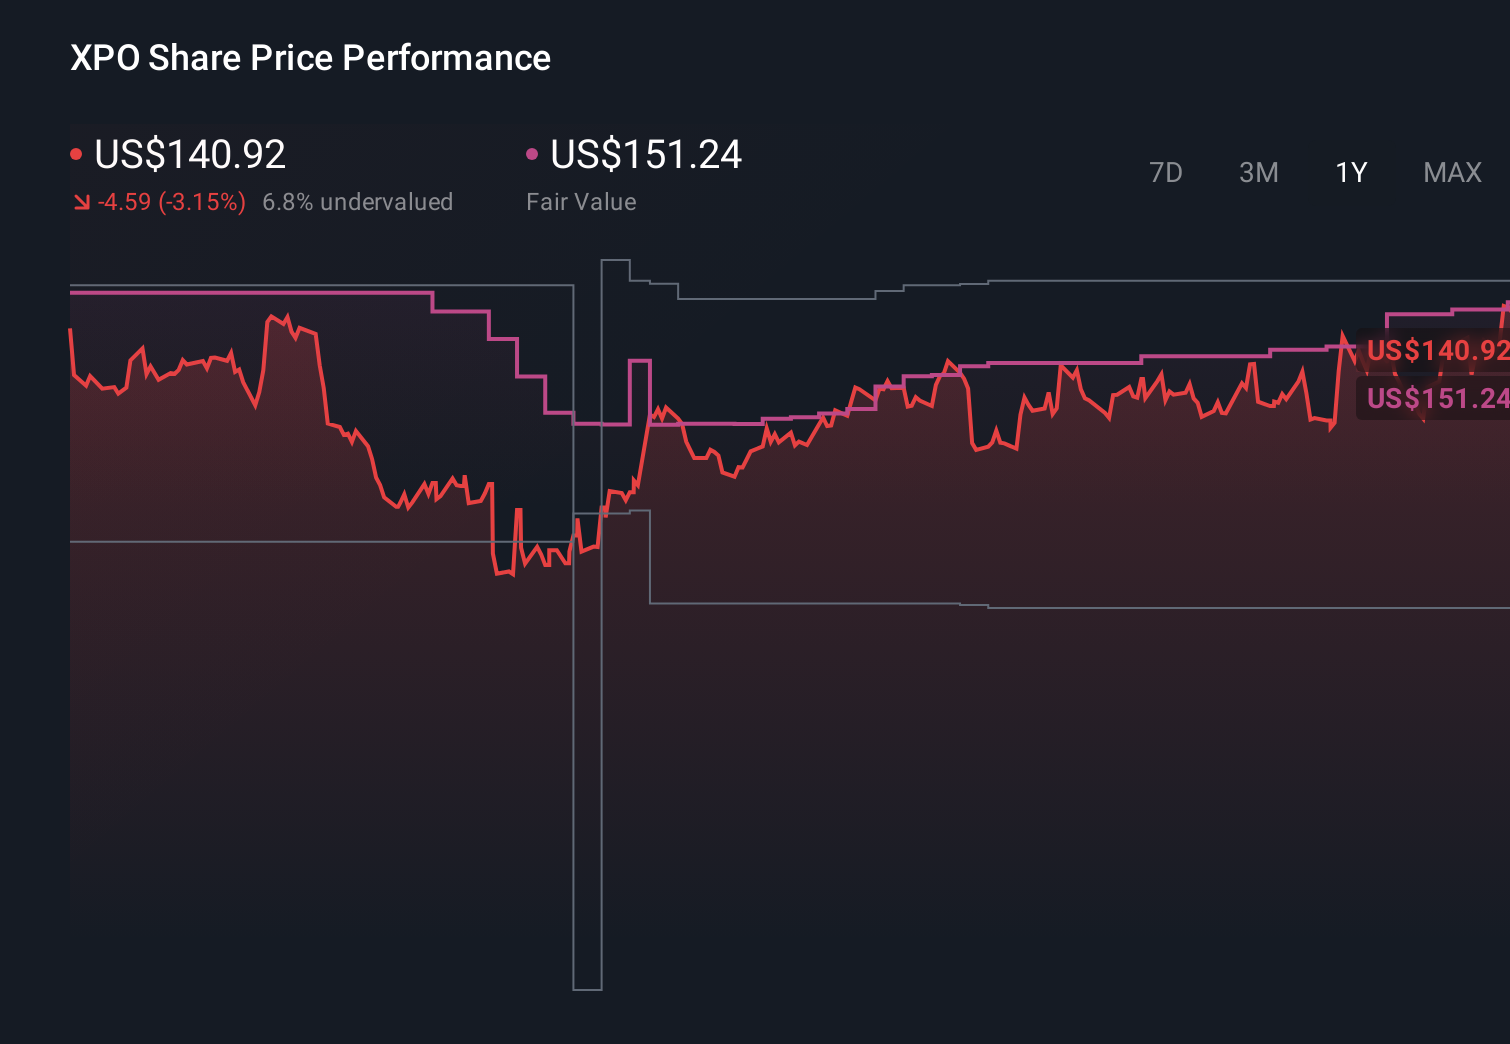
Uncover how XPO's forecasts yield a $207.04 fair value, a 6% downside to its current price.
Exploring Other Perspectives
While this recent news highlights XPO’s operational progress, the most pessimistic analysts still see risk, with revenue only reaching about US$9.6 billion and earnings around US$793.6 million by 2029, and a lower P/E multiple than today. They worry that accelerating automation and digital competitors could blunt XPO’s advantages, so it is worth comparing these cautious assumptions with more optimistic views before deciding how much weight to place on the current momentum.
Explore 3 other fair value estimates on XPO - why the stock might be worth as much as $207.04!
Form Your Own Verdict
Disagree with existing narratives? Extraordinary investment returns rarely come from following the herd, so go with your instincts.
- A great starting point for your XPO research is our analysis highlighting 1 key reward and 1 important warning sign that could impact your investment decision.
- Our free XPO research report provides a comprehensive fundamental analysis summarized in a single visual - the Snowflake - making it easy to evaluate XPO's overall financial health at a glance.
Curious About Other Options?
Our top stock finds are flying under the radar-for now. Get in early:
- The future of work is here. Discover the 35 top robotics and automation stocks leading the charge in AI-driven automation and industrial transformation.
- Rare earth metals are an input to most high-tech devices, military and defence systems and electric vehicles. The global race is on to secure supply of these critical minerals. Beat the pack to uncover the 30 best rare earth metal stocks of the very few that mine this essential strategic resource.
- Find 61 companies with promising cash flow potential yet trading below their fair value.
This article by Simply Wall St is general in nature. We provide commentary based on historical data and analyst forecasts only using an unbiased methodology and our articles are not intended to be financial advice. It does not constitute a recommendation to buy or sell any stock, and does not take account of your objectives, or your financial situation. We aim to bring you long-term focused analysis driven by fundamental data. Note that our analysis may not factor in the latest price-sensitive company announcements or qualitative material. Simply Wall St has no position in any stocks mentioned.