Is Yeti Holdings (YETI) Price Justified After Mixed Returns And DCF Valuation Gap
YETI Holdings YETI | 36.36 | -1.97% |
- If you are wondering whether YETI Holdings at around US$46.76 is a fair deal or not, this article will walk through what the current price might be saying about the stock's value.
- The share price has had mixed returns, with a 1.4% decline over the last week, a 4.3% gain over the past month and year to date, a 26.2% gain over the last year, and a 39.4% loss across five years, which can influence how investors think about both opportunity and risk.
- Recent attention around YETI has focused on how the brand and its products are holding up in a competitive consumer market, along with how investors are reacting to any changes in sentiment toward outdoor and premium consumer names. This context helps explain why the stock's performance has not been uniform across different time frames.
- On our framework, YETI scores 3 out of 6 on valuation checks. This means it screens as undervalued on half of the metrics we track. You can see the breakdown in this valuation score. Next, we will look at what different valuation methods say about YETI, then finish with a way to interpret valuation that goes beyond just the numbers.
Approach 1: YETI Holdings Discounted Cash Flow (DCF) Analysis
A Discounted Cash Flow, or DCF, model takes the cash a company is expected to generate in the future and discounts those amounts back to today, aiming to estimate what the entire business could be worth now.
For YETI Holdings, the model used is a 2 Stage Free Cash Flow to Equity approach. The latest twelve month Free Cash Flow is about $214.3 million. Analysts supply cash flow estimates for the next few years, and after that, Simply Wall St extrapolates longer term projections. Within these projections, one reference point is Free Cash Flow of $305 million in 2029, with a ten year path that runs from $179.7 million in 2026 to $410.2 million in 2035, all in dollar terms.
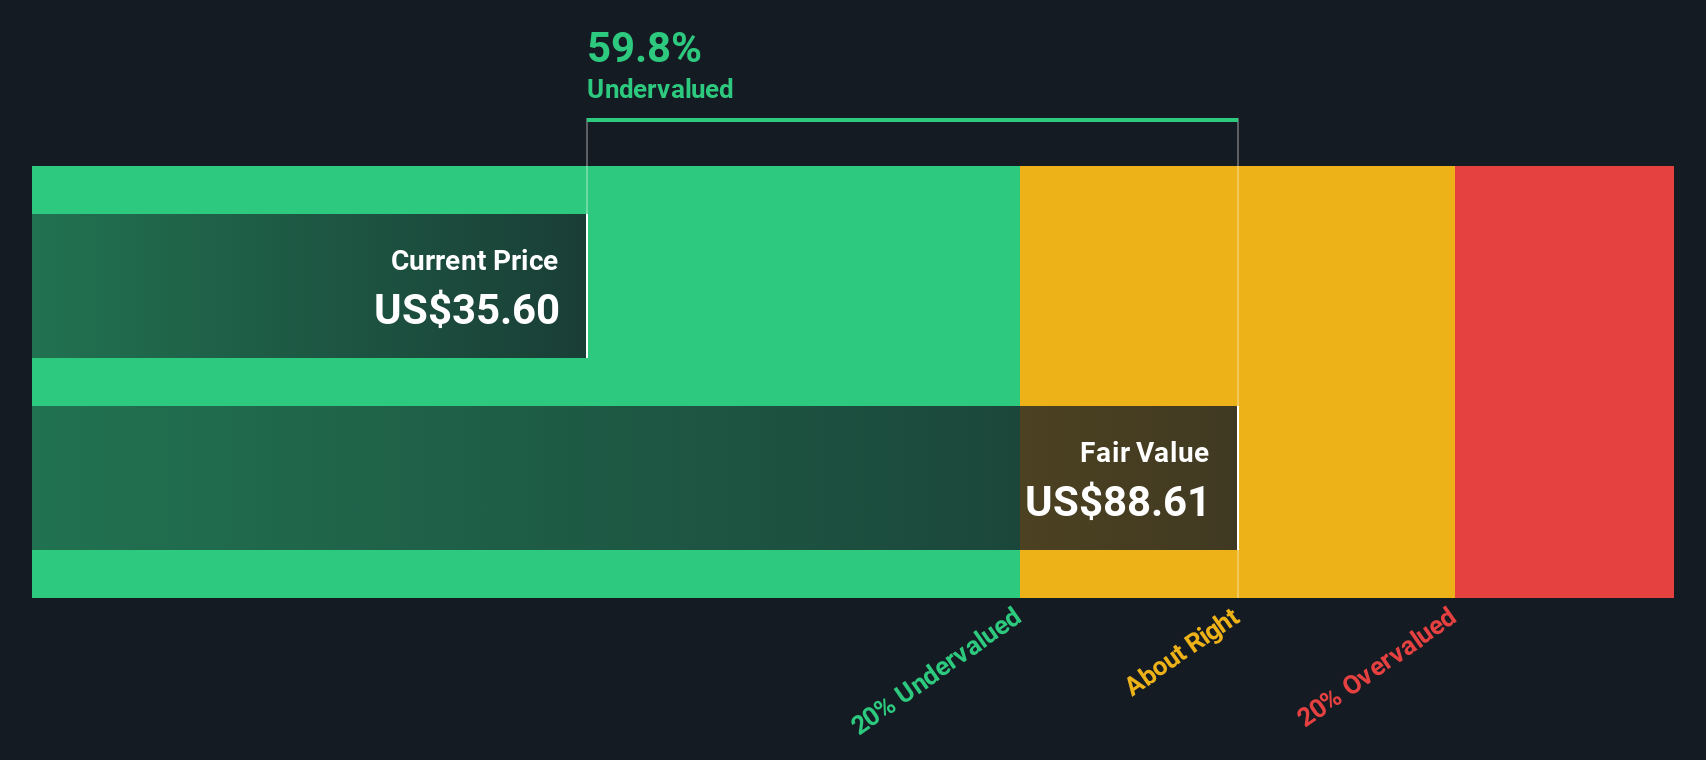
Bringing those projected cash flows back to today produces an estimated intrinsic value of about $94.12 per share. Compared with the current share price of around $46.76, the DCF output suggests the stock is about 50.3% undervalued on this model.
Result: UNDERVALUED
Our Discounted Cash Flow (DCF) analysis suggests YETI Holdings is undervalued by 50.3%. Track this in your watchlist or portfolio, or discover 873 more undervalued stocks based on cash flows.
Approach 2: YETI Holdings Price vs Earnings
For a profitable company like YETI Holdings, the P/E ratio is a useful way to relate what you are paying for each share to the earnings that business is currently generating. It gives a quick sense of how the market is pricing those earnings at today’s share price.
What counts as a “normal” P/E depends a lot on how the market views the company’s growth potential and risk profile. Higher growth and lower perceived risk can support a higher multiple, while slower growth or higher risk usually point to a lower, more conservative P/E.
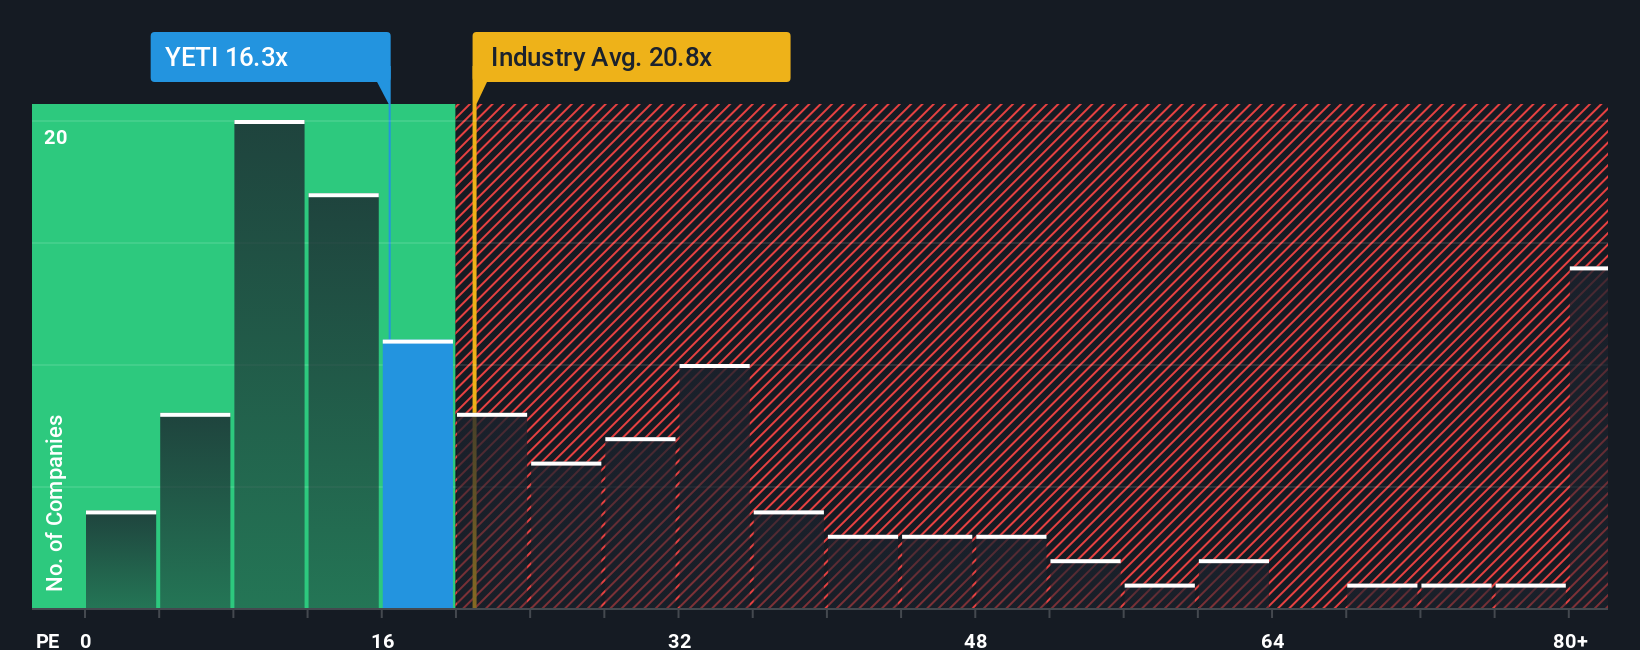
YETI is trading on a P/E of 22.69x, compared with the Leisure industry average of 22.29x and a peer group average of 32.62x. Simply Wall St’s “Fair Ratio” for YETI, which estimates the P/E you might expect given factors like earnings growth, profit margins, industry, market cap and specific risks, is 15.72x. This Fair Ratio is designed to be more tailored than simple peer or industry comparisons because it incorporates company specific characteristics rather than only looking sideways at what others trade on. On this measure, YETI’s actual P/E of 22.69x sits above the Fair Ratio of 15.72x. This suggests that, on this approach, the shares screen as overvalued.
Result: OVERVALUED
P/E ratios tell one story, but what if the real opportunity lies elsewhere? Discover 1426 companies where insiders are betting big on explosive growth.
Upgrade Your Decision Making: Choose your YETI Holdings Narrative
Earlier we mentioned that there is an even better way to understand valuation, so let us introduce you to Narratives, a simple way to connect your view of a company with the numbers you use to assess it.
A Narrative is your story about YETI Holdings, expressed through assumptions like fair value, future revenue, earnings and margins, instead of only relying on one model or a single P/E comparison.
On Simply Wall St’s Community page, used by millions of investors, Narratives link that story to a full financial forecast, then translate it into a fair value that you can compare with today’s share price to help you decide if YETI looks attractive or expensive for you.
Because Narratives update automatically when fresh information arrives, such as news or earnings releases, your fair value view can stay aligned with what is happening without you rebuilding spreadsheets every time.
For example, one YETI Holdings Narrative might assume strong long term brand momentum and arrive at a higher fair value. Another Narrative could assume more modest revenue growth and margin expectations and settle on a lower fair value. Together, these can give you a clearer sense of the range of views among investors.
Do you think there's more to the story for YETI Holdings? Head over to our Community to see what others are saying!

This article by Simply Wall St is general in nature. We provide commentary based on historical data and analyst forecasts only using an unbiased methodology and our articles are not intended to be financial advice. It does not constitute a recommendation to buy or sell any stock, and does not take account of your objectives, or your financial situation. We aim to bring you long-term focused analysis driven by fundamental data. Note that our analysis may not factor in the latest price-sensitive company announcements or qualitative material. Simply Wall St has no position in any stocks mentioned.