Janus Henderson Group (JHG) Looks About Right, Is The DCF Warning Hard To Ignore?
Janus Henderson Group PLC JHG | 0.00 |
Janus Henderson Group Stock Performance Snapshot
Janus Henderson Group (JHG) recently closed at $51.93, giving the asset manager a market value of about $8.0b. The stock’s return over the past year sits at 36.21%, with a 112.22% total return over 3 years.
For investors tracking longer trends, Janus Henderson Group shows a 64.80% total return over 5 years and an 8.69% gain year to date. In the shorter term, the stock is roughly flat over the past week and month, and up about 1.09% over the past 3 months.
Putting this in context, Janus Henderson Group’s recent share price movement has been relatively steady. Its 1 year and multi year total shareholder returns point to stronger results for long term holders and a shift in how the market is pricing its earnings and risk profile.
If you are comparing Janus Henderson Group with other opportunities in the market, it can be helpful to see where capital is flowing into resilient themes such as AI infrastructure, and 51 AI infrastructure stocks
With Janus Henderson Group trading close to analyst price targets and recent revenue rising while net income declined, investors are left with a key question: is the stock undervalued today or already pricing in future growth?
Most Popular Narrative: 1% Undervalued
Janus Henderson Group’s most followed valuation story pegs fair value at about $52.67, only slightly above the last close at $51.93, so the gap is tight but meaningful for investors watching small mispricings.
The analysts have a consensus price target of $52.67 for Janus Henderson Group based on their expectations of its future earnings growth, profit margins and other risk factors.
In order for you to agree with the analysts, you would need to believe that by 2029, revenues will be $3.2 billion, earnings will come to $591.7 million, and it would be trading on a PE ratio of 16.8x, assuming you use a discount rate of 8.4%.
Want to see what is sitting behind that near flat revenue outlook, lower margin profile, and higher future earnings multiple? The core of this narrative rests on how Janus Henderson Group’s earnings power, share count and discount rate interact to justify today’s price tag. Curious which assumptions do the heavy lifting in that $52.67 fair value and how sensitive the story is to small shifts in profit expectations? The full breakdown spells it out.
Result: Fair Value of $52.67 (ABOUT RIGHT)
However, the Janus Henderson Group story can shift quickly if client outflows persist, or if fee compression and rising expenses weigh more heavily on margins than expected.
Another View: Janus Henderson Group Through a Cash Flow Lens
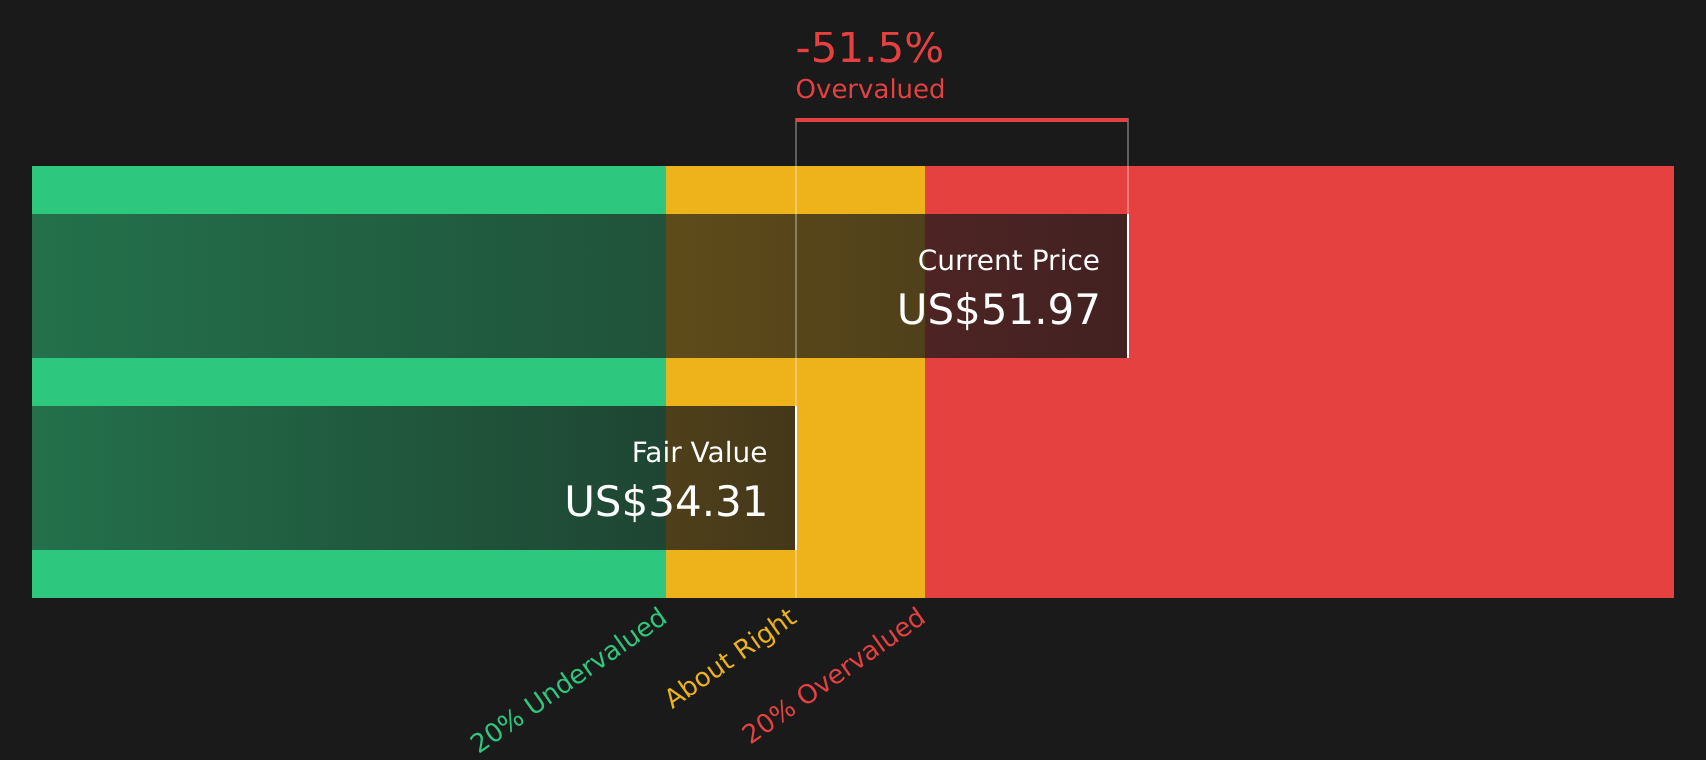
While the analyst fair value for Janus Henderson Group sits close to the current share price, the SWS DCF model tells a very different story. On that framework, JHG at $51.93 is trading well above an estimated future cash flow value of $25.68, which points to a stock that screens as overvalued on cash flows.
This gap between earnings based fair value and cash flow based value raises a simple question for investors: which set of assumptions feels more realistic for Janus Henderson Group over time, the one embedded in earnings multiples or the one in the DCF cash flow path?
Simply Wall St performs a discounted cash flow (DCF) on every stock in the world every day (check out Janus Henderson Group for example). We show the entire calculation in full. You can track the result in your watchlist or portfolio and be alerted when this changes, or use our stock screener to discover 44 high quality undervalued stocks. If you save a screener we even alert you when new companies match - so you never miss a potential opportunity.
Next Steps
With mixed signals on Janus Henderson Group’s valuation and a balance of risks and rewards in play, it can be useful to review the numbers yourself and decide where you stand. To weigh both sides in one place, take a closer look at the 3 key rewards and 2 important warning signs
Looking for More Investment Ideas Beyond Janus Henderson Group?
If Janus Henderson Group has you thinking more broadly about where to put your next dollar to work, do not stop at a single stock story.
- Spot potential bargains early by checking companies that currently screen as undervalued on quality and price with the 44 high quality undervalued stocks
- Focus on stability and sleep a little easier at night by reviewing companies highlighted in the 69 resilient stocks with low risk scores
- Hunt for future standouts before the crowd by scanning the screener containing 19 high quality undiscovered gems
This article by Simply Wall St is general in nature. We provide commentary based on historical data and analyst forecasts only using an unbiased methodology and our articles are not intended to be financial advice. It does not constitute a recommendation to buy or sell any stock, and does not take account of your objectives, or your financial situation. We aim to bring you long-term focused analysis driven by fundamental data. Note that our analysis may not factor in the latest price-sensitive company announcements or qualitative material. Simply Wall St has no position in any stocks mentioned.