Janus Henderson Group (JHG) Stock Could Be 1.5% Undervalued as ETF Narrative Meets DCF Doubts
Janus Henderson Group PLC JHG | 0.00 |
Recent Performance Context for Janus Henderson Group
Janus Henderson Group (JHG) has drawn investor attention after recent trading, with the stock last closing at $51.88. The company, an asset management holding entity, reports revenue of $3,165.9 million and net income of $769.2 million.
Recent trading has been relatively steady, but Janus Henderson Group’s 8.58% year to date share price return alongside a 43.93% 1 year total shareholder return suggests that momentum has been building over a longer horizon as investors reassess both growth prospects and risk.
If you are comparing Janus Henderson Group with other income focused opportunities, this could be a good moment to scan for 8 dividend fortresses
With Janus Henderson Group trading close to analyst price targets and recent returns already strong, the key question is whether today’s valuation still leaves headroom for investors or if the market is already pricing in future growth.
Most Popular Narrative: 1.5% Undervalued
Janus Henderson Group’s most followed narrative puts fair value at $52.67, just above the recent $51.88 close, framing the stock as only modestly mispriced.
Expanding and innovating in active fixed income ETFs and tokenized funds positions the firm to benefit from rising demand for differentiated, outcome-oriented, and technology-enabled investment solutions, directly driving revenue and helping maintain or improve net margins in a fee-compressed environment.
Curious how a relatively small gap between price and fair value can rest on flat revenues, slimmer margins, and a higher future earnings multiple. The full narrative connects those moving parts into one valuation story.
Result: Fair Value of $52.67 (ABOUT RIGHT)
However, ongoing fee compression and persistent retail outflows mean Janus Henderson Group’s asset base and margins could still fall short of the assumptions behind this modest undervaluation story.
Another View on Janus Henderson Group’s Value
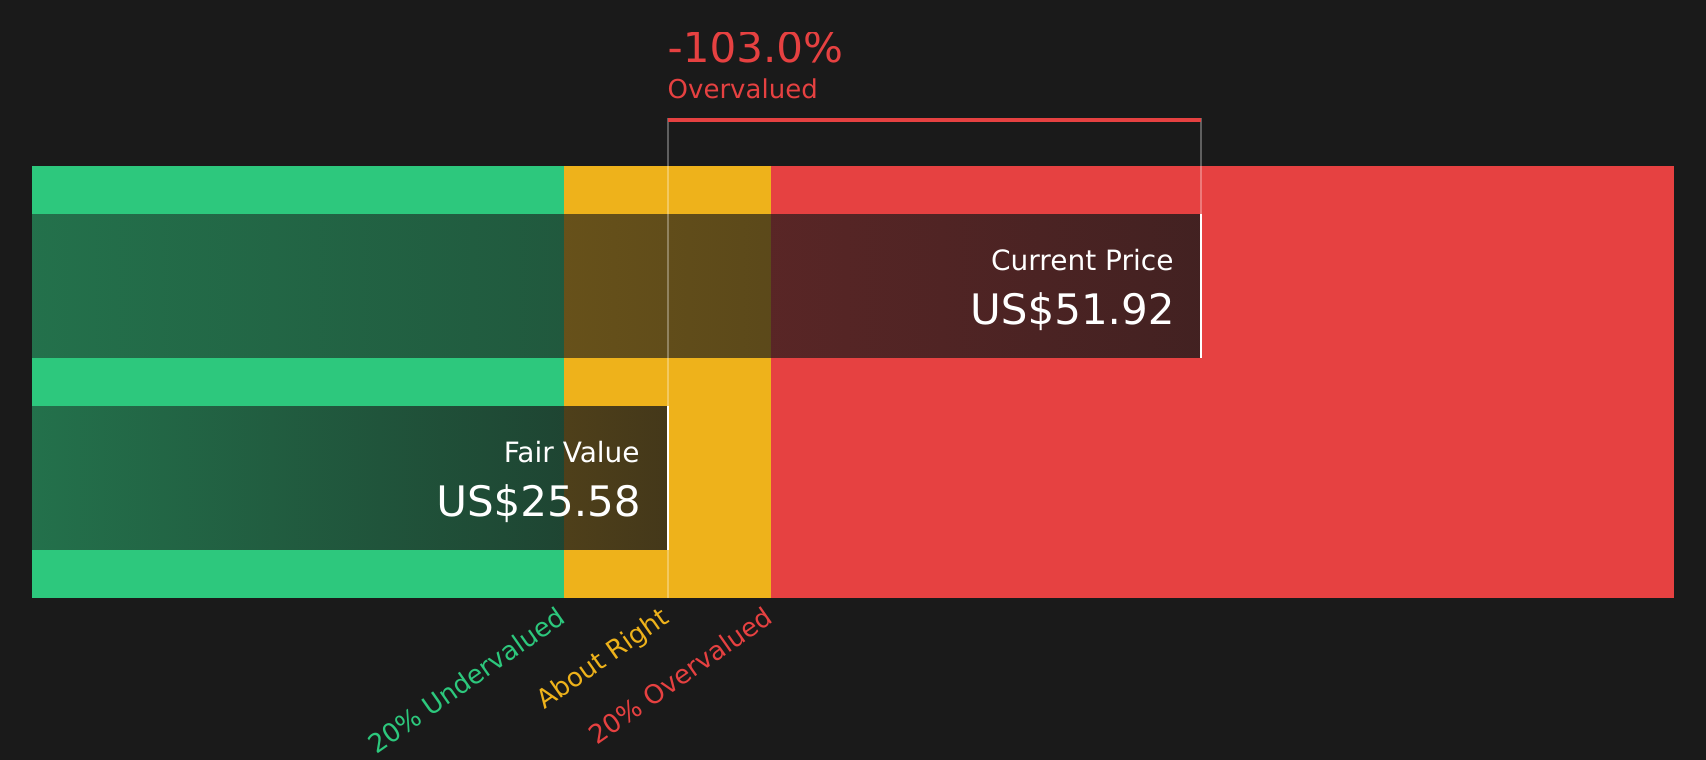
While the main narrative focuses on fair value around $52.67, the SWS DCF model presents a different picture. On that approach, Janus Henderson Group at $51.88 is trading above an estimated future cash flow value of $25.58, which suggests the stock could be overvalued.
For investors, that gap raises a simple question: which set of assumptions feels more realistic for how Janus Henderson Group will generate cash over time, and what risks you are really being compensated for?
Simply Wall St performs a discounted cash flow (DCF) on every stock in the world every day (check out Janus Henderson Group for example). We show the entire calculation in full. You can track the result in your watchlist or portfolio and be alerted when this changes, or use our stock screener to discover 45 high quality undervalued stocks. If you save a screener we even alert you when new companies match - so you never miss a potential opportunity.
Next Steps
The mixed signals around Janus Henderson Group can feel confusing, so consider moving quickly from reading to checking the underlying numbers and sentiment yourself, then weigh the 3 key rewards and 2 important warning signs
Looking for more investment ideas beyond Janus Henderson Group?
If Janus Henderson Group has you thinking more broadly about your portfolio, now is the time to uncover fresh opportunities that match your goals before others step in.
- Spot potential bargains early by scanning screener containing 19 high quality undiscovered gems that pair solid fundamentals with lower market attention.
- Strengthen your core holdings by reviewing solid balance sheet and fundamentals stocks screener (48 results) designed to highlight companies with sturdier financial foundations.
- Dial down volatility by focusing on 66 resilient stocks with low risk scores that score well on resilience and downside protection.
This article by Simply Wall St is general in nature. We provide commentary based on historical data and analyst forecasts only using an unbiased methodology and our articles are not intended to be financial advice. It does not constitute a recommendation to buy or sell any stock, and does not take account of your objectives, or your financial situation. We aim to bring you long-term focused analysis driven by fundamental data. Note that our analysis may not factor in the latest price-sensitive company announcements or qualitative material. Simply Wall St has no position in any stocks mentioned.