

Janus Living (JAN) Raised $464 Million, But Is The Valuation Already Full?
Janus Living, Inc. Class A JAN | 0.00 |
Janus Living (JAN) has completed a $464 million follow on equity offering of 16,000,000 Class A 1 common shares at $29 each, reflecting a discount of $1.0875 per share.
Janus Living shares have gained momentum in recent months, with a 14.8% 90 day share price return and 29.8% year to date share price return, as investors respond to stronger earnings, raised 2026 guidance and the completed equity raise.
If this kind of activity has your attention, it may be a good moment to broaden your watchlist with 20 top founder-led companies
Janus Living now has fresh capital, faster recent earnings progress and a higher share price. The harder question is whether this senior housing REIT is already priced for that improvement or still offers value.
Price-to-Sales of 9.8x: Is it justified?
Janus Living last closed at $30.63, and based on a P/S ratio of 9.8x it screens as expensive compared to both its health care REIT peers and the wider industry.
The P/S ratio compares the company’s market value to its revenue and is often used for REITs where earnings can be affected by accounting treatments. For Janus Living, it gives a quick sense of how much investors are paying for each dollar of senior housing revenue across its 34 communities.
Analysts currently forecast that Janus Living’s revenue will grow around 22.9% per year, which is faster than the broader US market. At the same time, earnings are projected to decline by an average of 10% per year over the next three years and recent profit figures include a large one off gain of $23.9m. That mix of strong revenue growth expectations and weaker profit outlook can help explain why the market is attaching a relatively high P/S multiple rather than rewarding earnings progress.
Compared to the peer average P/S of 7.4x and the global health care REITs average of 6.4x, Janus Living’s 9.8x stands out as meaningfully richer. If those revenue and earnings expectations were to change, the multiple could also shift. It is worth viewing today’s pricing in that broader context.
Result: Price-to-sales of 9.8x (OVERVALUED)
However, there are clear risks if Janus Living’s revenue growth or earnings trajectory falls short, which could challenge both its premium P/S multiple and recent share price momentum.
Another view on Janus Living’s value
While the 9.8x P/S ratio makes Janus Living look expensive next to health care REIT peers, the SWS DCF model points the other way. On that approach, the stock at $30.63 is trading about 59.1% below an estimated future cash flow value of $74.95, which signals potential undervaluation. Which lens do you trust more when the signals conflict like this?
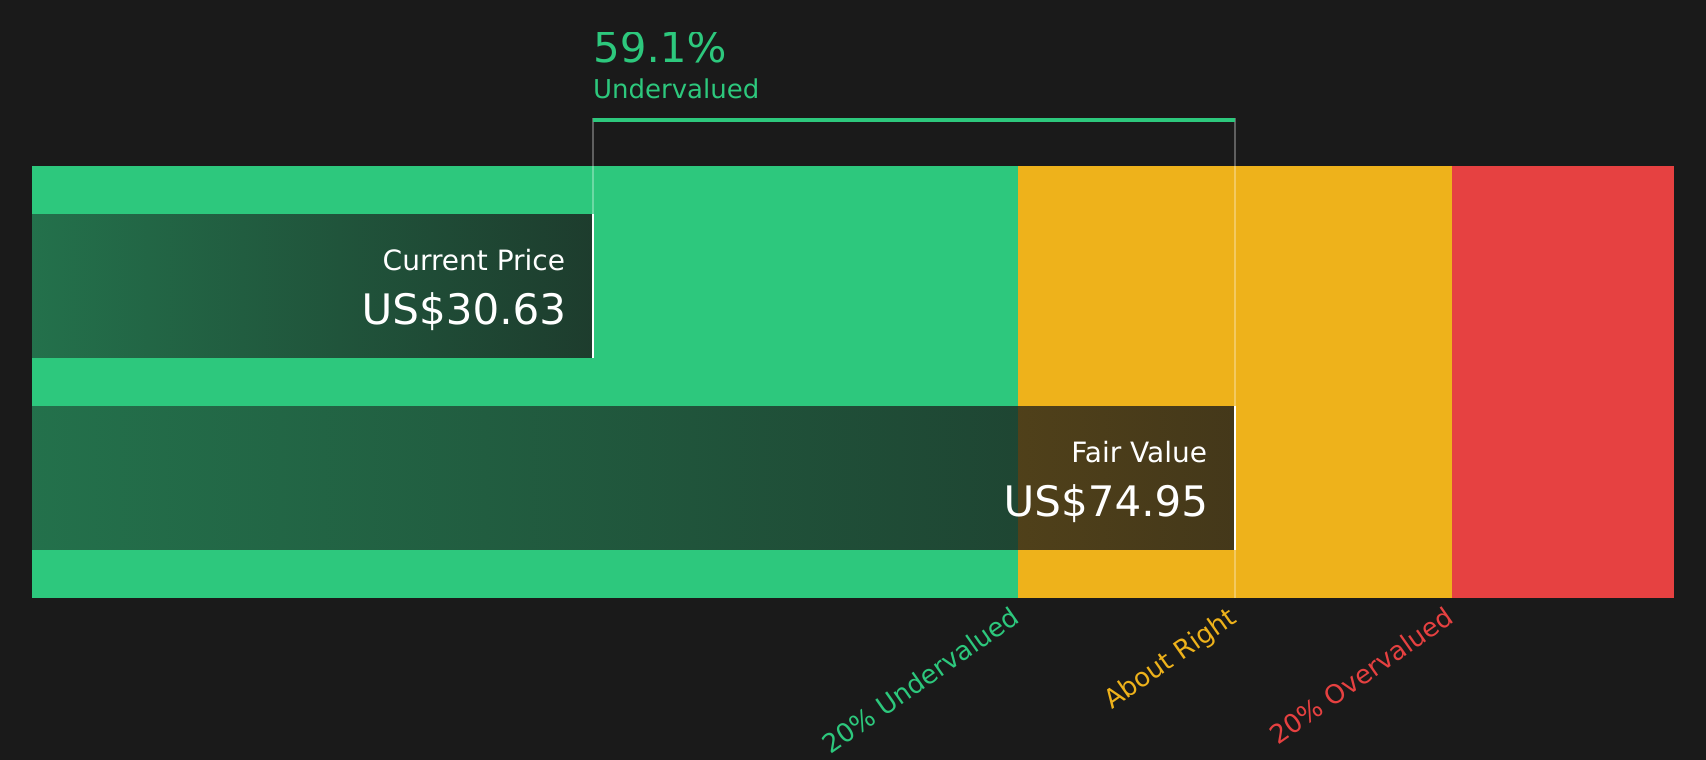
Simply Wall St performs a discounted cash flow (DCF) on every stock in the world every day (check out Janus Living for example). We show the entire calculation in full. You can track the result in your watchlist or portfolio and be alerted when this changes, or use our stock screener to discover 50 high quality undervalued stocks. If you save a screener we even alert you when new companies match - so you never miss a potential opportunity.
Next Steps
The mixed signals around Janus Living’s valuation and outlook make this a moment to move quickly, review the full data, and form your own view with 3 key rewards and 3 important warning signs.
Looking for more investment ideas beyond Janus Living?
If Janus Living has sharpened your focus, do not stop there. Use fresh stock ideas to pressure test your thinking and keep your portfolio options open.
- Spot potential mispricing opportunities by checking out companies highlighted in 50 high quality undervalued stocks.
- Strengthen your income stream by reviewing stocks featured in 10 dividend fortresses.
- Reduce portfolio stress by assessing companies flagged in 83 resilient stocks with low risk scores.
This article by Simply Wall St is general in nature. We provide commentary based on historical data and analyst forecasts only using an unbiased methodology and our articles are not intended to be financial advice. It does not constitute a recommendation to buy or sell any stock, and does not take account of your objectives, or your financial situation. We aim to bring you long-term focused analysis driven by fundamental data. Note that our analysis may not factor in the latest price-sensitive company announcements or qualitative material. Simply Wall St has no position in any stocks mentioned.