

JBT Marel (JBTM) Looks Undervalued As Strong Results And 2026 Guidance Reset The Story
JBT Marel Corporation JBTM | 0.00 |
JBT Marel (JBTM) is back in focus after reporting second quarter and half year 2026 results, along with fresh full year guidance that spells out management’s revenue, earnings and net income expectations.
Despite stronger earnings and fresh 2026 guidance, JBT Marel’s share price return is down 20.19% year to date and about 10.31% over the past month, while the 3 year total shareholder return of 13.01% suggests longer term holders have seen a very different experience to the more recent weakness.
If this kind of mixed momentum has you thinking about where else to put fresh capital to work, it could be a good moment to scan 21 top founder-led companies.
JBT Marel now looks like a solidly profitable food processing equipment business again, yet the share price has slipped this year. So is that weakness offering value or signalling that expectations already run too high?
Preferred Price-to-Earnings of 32.1x: Is it justified?
On Simply Wall St's numbers, JBT Marel trades on a P/E of 32.1x at a last close of $120.18, which sits below its own estimated fair P/E yet above the wider US Machinery industry.
The P/E multiple compares what investors are currently paying for each dollar of JBT Marel's earnings. For a food and beverage equipment supplier that has only recently returned to profitability, this kind of multiple often reflects expectations for more stable earnings ahead rather than past performance alone.
JBT Marel is described as good value on two fronts. First, its P/E of 32.1x is below an estimated fair P/E of 49.3x, a level the market could move towards if earnings and cash flows progress in line with those underlying assumptions. Second, the same 32.1x sits well under the 68.8x peer average cited in the data, which suggests investors are paying less for each unit of earnings than for comparable companies, even though the stock is described as expensive relative to the broader US Machinery industry average P/E of 27.6x.
Result: Price-to-Earnings of 32.1x (UNDERVALUED)
However, there are still clear risks for JBT Marel if food industry capex softens or if its relatively high P/E multiple compresses because of changing investor sentiment.
Another view on JBT Marel using the SWS DCF model
The P/E of 32.1x presents JBT Marel as underpriced compared with a 49.3x fair ratio and a 68.8x peer average. The SWS DCF model offers a different angle. At $120.18, the stock sits below an estimated future cash flow value of $289.15, which also suggests undervaluation.
Both methods point in the same direction, but each relies on different assumptions about future earnings and cash generation. That raises an important question for you: Which set of assumptions feels more realistic for how JBT Marel will perform over time
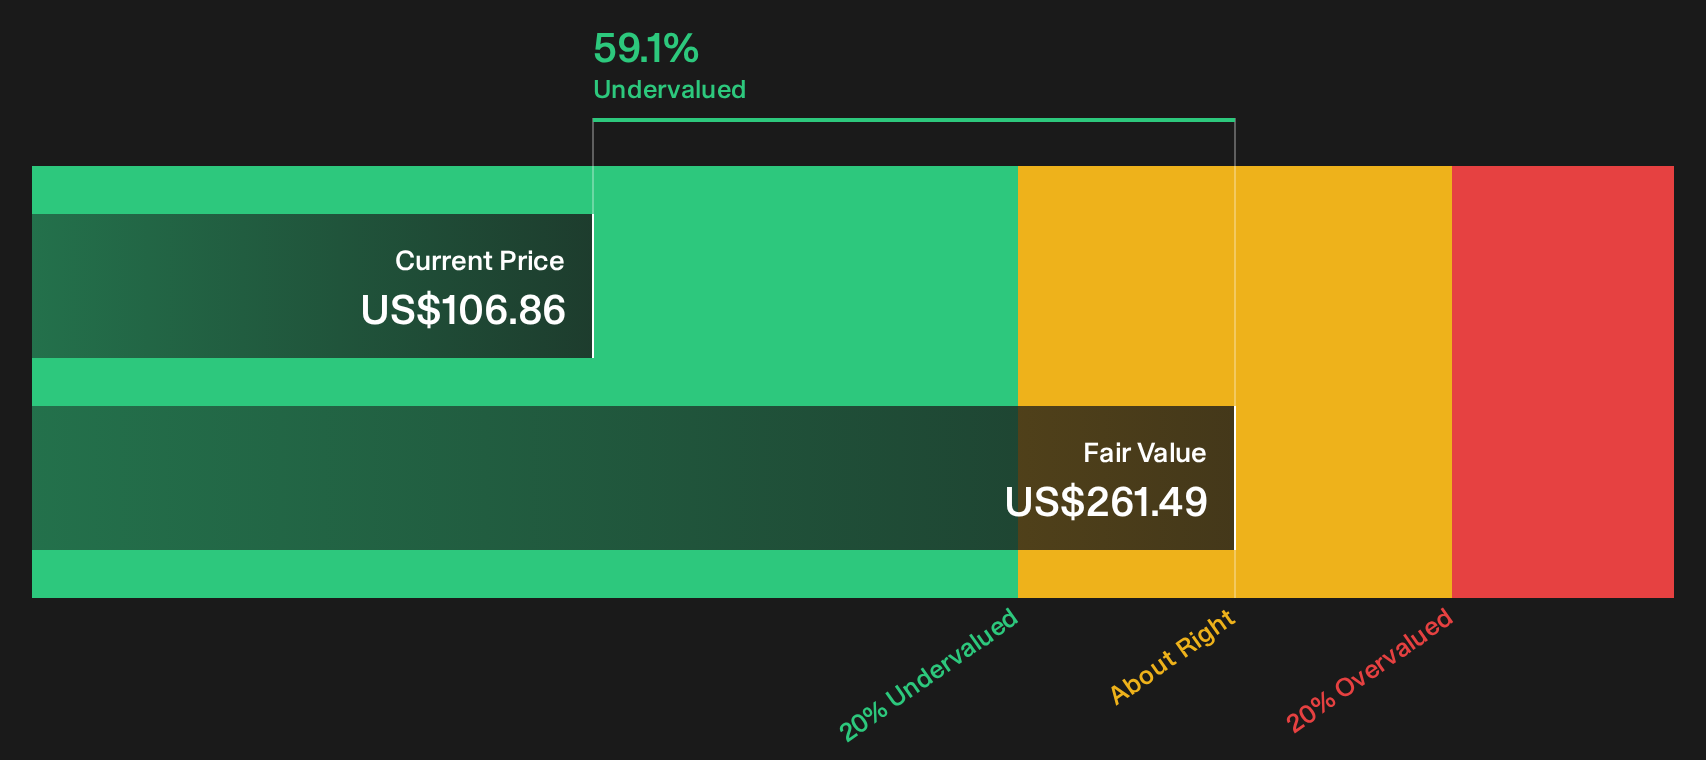
Simply Wall St performs a discounted cash flow (DCF) on every stock in the world every day (check out JBT Marel for example). We show the entire calculation in full. You can track the result in your watchlist or portfolio and be alerted when this changes, or use our stock screener to discover 52 high quality undervalued stocks. If you save a screener we even alert you when new companies match - so you never miss a potential opportunity.
Next Steps
With both risks and rewards in play for JBT Marel, sentiment on the stock is understandably mixed, so it makes sense to move quickly and assess the details that matter most to you. To see a concise breakdown of both sides of the story, review the 3 key rewards and 1 important warning sign.
Looking for more investment ideas beyond JBT Marel?
If JBT Marel has sharpened your focus on quality and price, now is the time to widen your search and avoid missing opportunities that better fit your style.
- Target high quality at a discount by reviewing companies highlighted in the 52 high quality undervalued stocks.
- Prioritise strength and resilience by checking stocks in the solid balance sheet and fundamentals stocks screener (51 results).
- Spot potential future standouts early by scanning the screener containing 20 high quality undiscovered gems.
This article by Simply Wall St is general in nature. We provide commentary based on historical data and analyst forecasts only using an unbiased methodology and our articles are not intended to be financial advice. It does not constitute a recommendation to buy or sell any stock, and does not take account of your objectives, or your financial situation. We aim to bring you long-term focused analysis driven by fundamental data. Note that our analysis may not factor in the latest price-sensitive company announcements or qualitative material. Simply Wall St has no position in any stocks mentioned.