JEPI Secured a Steady 5% in 2 Months! How to Use Covered Calls to Navigate US Market Volatility
S&P 500 index SPX | 0.00 | |
JPMORGAN EQUITY PREMIUM INCOME ETF JEPI | 0.00 | |
ETF-S&P 500 SPY | 0.00 | |
J.P. MORGAN NASDAQ EQUITY PREMIUM INCOME ETF JEPQ | 0.00 | |
Horizons Etf Trust I Horizons Nasdaq 100 Covered Call Etf QYLD | 0.00 |
Since the beginning of 2026, U.S. equities have been locked in severe turbulence, driven by conflict in the Middle East, panic over "AI disruption," and tariff headwinds. The VIX volatility index has climbed more than 40% year-to-date, making market "uncertainty" the new normal.
In this high-volatility environment, although the S&P 500 index(SPX.US) has managed a modest 0.65% gain this year, rapid sector rotation and frequent "black swan events" have sharply deteriorated sentiment for retail investors. Many are caught in a dilemma: fearing a major market correction on one hand, yet unwilling to miss out on the dividends of the AI era on the other.
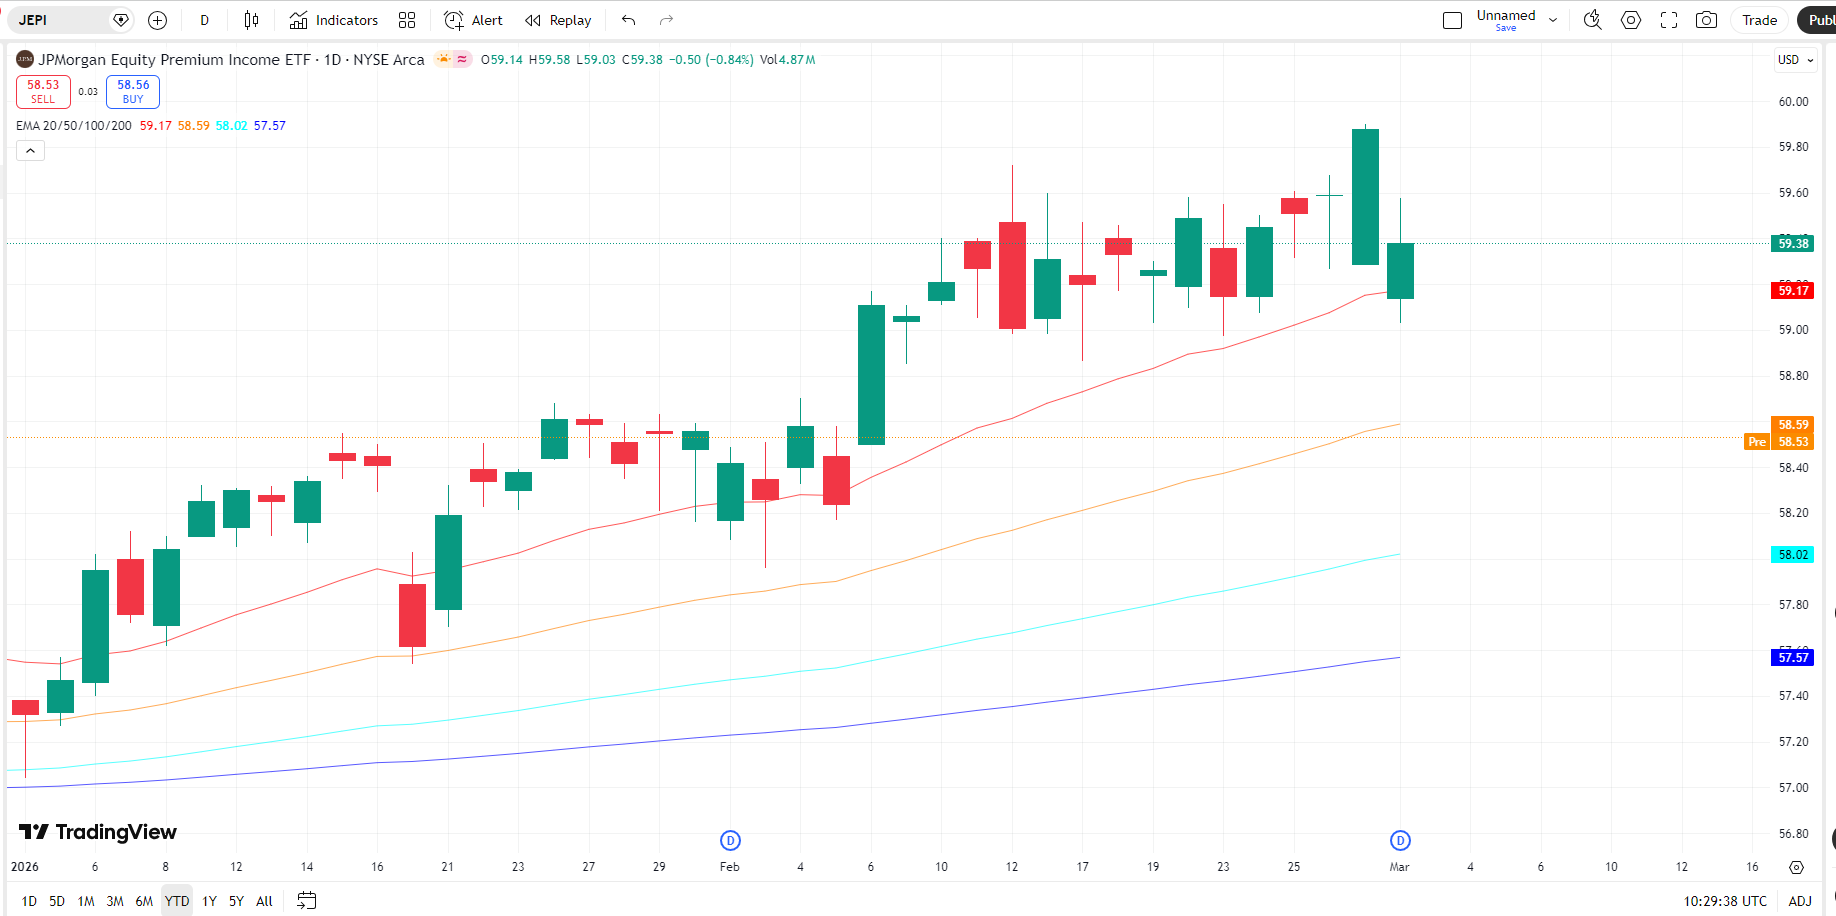
Rather than reducing positions or sitting on the sidelines, the "Covered Call" strategy has emerged as a clear winner. The JPMORGAN EQUITY PREMIUM INCOME ETF(JEPI.US) has delivered a stunning gain of over 5% this year, significantly outperforming the broader market ETF-S&P 500(SPY.US).
Why has JPMORGAN EQUITY PREMIUM INCOME ETF(JEPI.US) managed to achieve low-volatility gains while tracking the same index? How should investors adjust their trading strategies in the current environment to avoid the trap of "chasing highs and selling lows"? Here is a breakdown of the Covered Call strategy's appeal.
JEPI Sees Stunning 5% YTD Gain: Covered Call ETF Advantage Highlights in Choppy Market
Take the $44 billion JPMORGAN EQUITY PREMIUM INCOME ETF(JEPI.US)—the world’s largest covered call ETF—as an example. The fund executes its strategy by holding S&P 500 constituent stocks and selling call options. Amid this year’s market oscillation and high implied volatility (IV) environment, the fund has achieved a 5% gain through option premiums alone.
Specifically, investors receive regular option premium dividends, similar to a "landlord collecting rent." The covered call strategy shines when the broader market is volatile, in a slow bull run, moving sideways, or undergoing a minor correction.
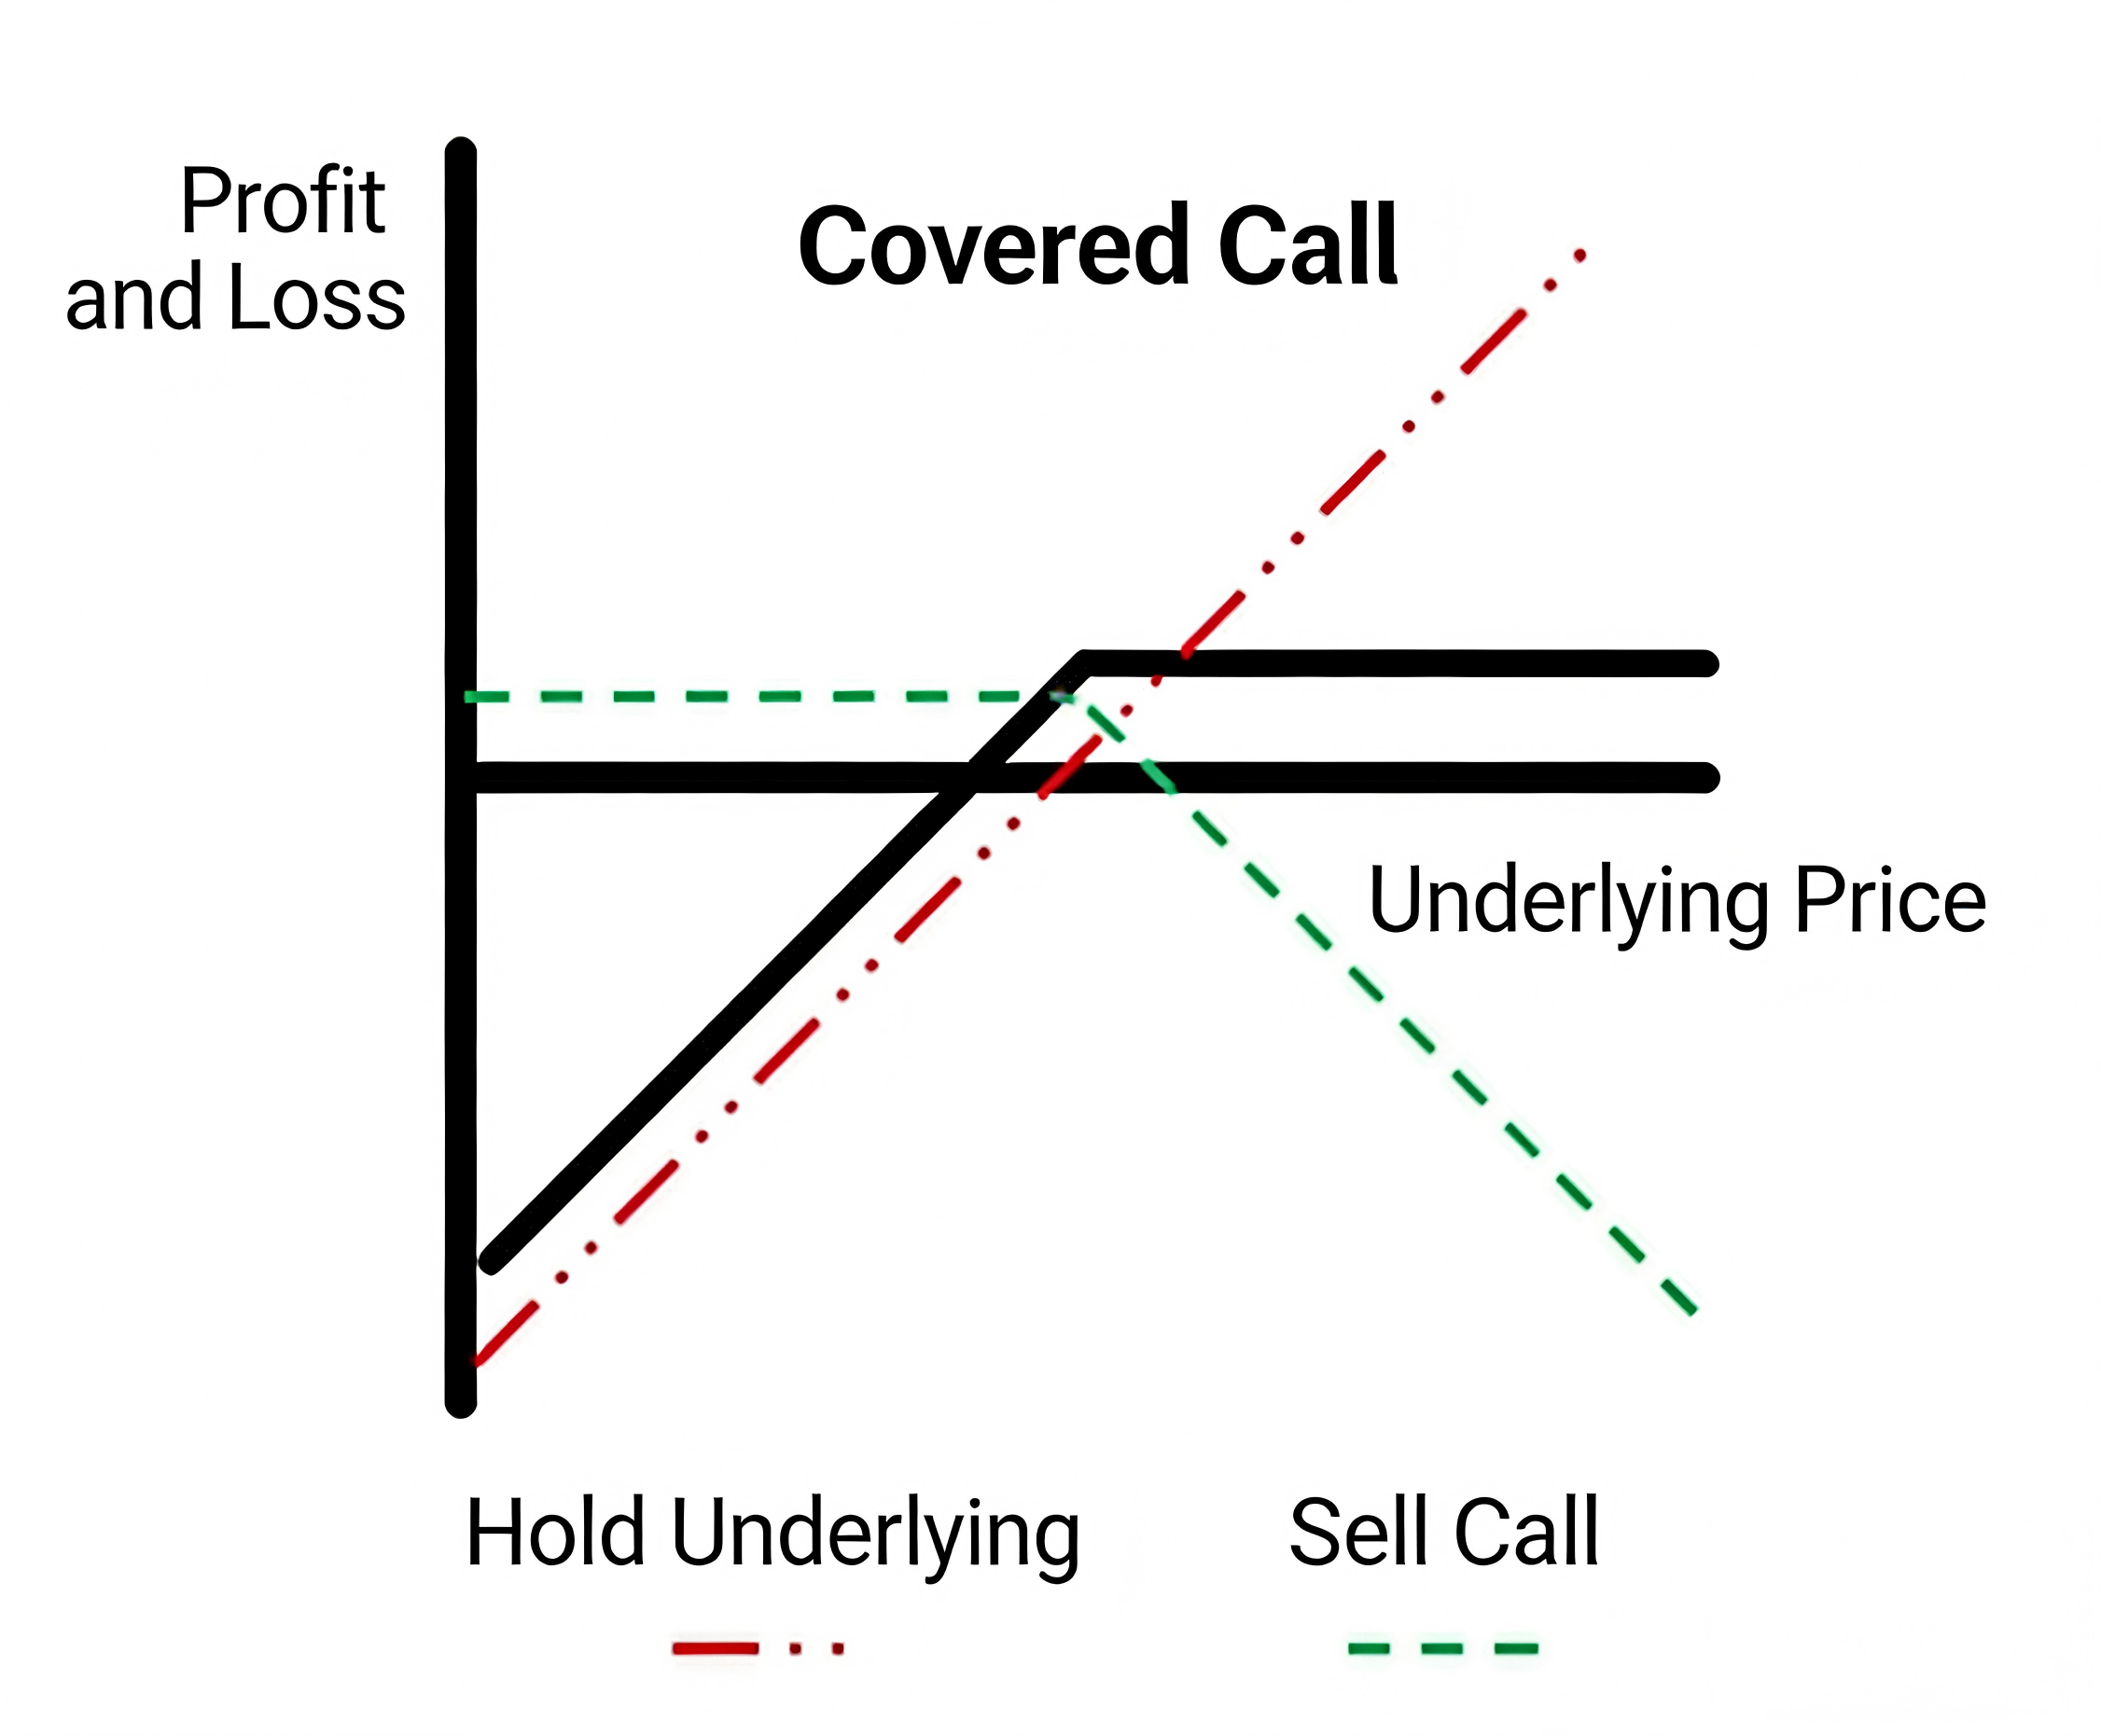
How the Returns Are Calculated (Simplified):
Assumption: Stock price is $100. You sell a Call option expiring in one month with a strike price of $105, receiving a $3 premium ($300 for 100 shares).
Three Possible Outcomes:
- Price < $100: The option expires worthless → You keep the free $300. This offsets the stock's decline, meaning you lose 3% less than a pure stockholder.
- $100 ≤ Price ≤ $105: The option expires worthless → You keep the free $300 and also profit from the stock's appreciation.
- Price > $105: The stock is called away (exercised) at $105 → You earn: $(105-100) + $3 = $8 profit. However, you forego any gains the stock makes above $105.
Analytically, the ETF-S&P 500(SPY.US) currently fits into scenario ② described above. While stock prices haven't moved much amid the violent oscillation this year, JPMORGAN EQUITY PREMIUM INCOME ETF(JEPI.US) has realized "easy profits" through option premiums. Moreover, as the ETF utilizes rolling transactions managed by JPMorgan, it is more time-efficient and professionally rational than manual trading.
Data from Sahm shows that while JEPI may slightly underperform the index during bull markets, its overall volatility and drawdowns are contained. Notably, when the S&P plunged nearly 20% in 2022, JEPI fell only 6.3%, demonstrating the strategy’s strength during choppy and bear markets.
| Year | Annualized Return (JEPI) | Annualized Volatility (JEPI) | Max Drawdown (JEPI) | |||
|---|---|---|---|---|---|---|
| Total | 11.8% | 15.7% | 11.0% | 17.0% | -14.9% | -25.4% |
| 2026 | 5.02% | 0.65% | 9.1% | 12.4% | -1.3% | -2.6% |
| 2025 | 9.1% | 16.4% | 13.6% | 18.6% | -13.4% | -18.9% |
| 2024 | 13.8% | 23.3% | 8.0% | 12.6% | -4.8% | -8.5% |
| 2023 | 9.3% | 24.2% | 8.7% | 13.0% | -6.4% | -10.3% |
| 2022 | -6.3% | -19.4% | 15.4% | 24.0% | -14.9% | -25.4% |
| 2021 | 23.3% | 26.9% | 8.4% | 13.0% | -4.5% | -5.2% |
| 2020 | 17.5% | 26.4% | 9.6% | 18.4% | -3.7% | -9.6% |
How Should Retail Investors Build a Covered Call Position? Timing and Suitability
When is the best time to invest in Covered Call ETFs? Generally, when uncertainty exists and the market is expected to rise slightly or trade sideways, JPMORGAN EQUITY PREMIUM INCOME ETF(JEPI.US) can provide relatively stable returns and lower holding costs.
Ideal Scenarios:
- You want to hold stocks long-term (believing in AI dividends) but don't want to sell.
- You believe the market won't skyrocket in the short term but will oscillate or rise slowly (due to Middle East conflict, tariffs).
- Current U.S. Market: S&P is rising with volatility, and IV is increasing—a perfect environment for this strategy.
Note: If you expect the market to surge immediately, JPMORGAN EQUITY PREMIUM INCOME ETF(JEPI.US) and similar Covered Call strategies are not recommended as they cap your upside potential.
In summary, JPMORGAN EQUITY PREMIUM INCOME ETF(JEPI.US) and similar ETFs are suitable for conservative investors who dislike high volatility, have a low risk tolerance, and are willing to forego some potential upside in exchange for consistent cash flow.
Practical Tips for Covered Calls:
- Sell Out-of-the-Money (OTM): Earn premiums while retaining some upside potential.
- Sell Near-Month: Capitalize on the fastest time decay for higher efficiency.
- Watch the IV: The higher the Implied Volatility, the more lucrative it is to sell Calls.
- Downside Warning: Covered Calls cannot prevent major crashes; they only cushion the loss.
Core Index and Single-Stock Covered Call ETF Overview
We screened key data for 10 popular, highly liquid ETFs in the U.S. market (as of March 3, 2026):
| ETF | Underlying Asset | Current Yield | AUM ($USD) |
|---|---|---|---|
| JPMORGAN EQUITY PREMIUM INCOME ETF(JEPI.US) | S&P 500 Index | 8.57% | 44.14B |
| J.P. MORGAN NASDAQ EQUITY PREMIUM INCOME ETF(JEPQ.US) | Nasdaq Index | 11.54% | 34.60B |
| Horizons Etf Trust I Horizons Nasdaq 100 Covered Call Etf(QYLD.US) | Nasdaq Index | 11.60% | 8.30B |
| GLOBAL X FDS S&P 500 COVERED CALL ETF(XYLD.US) | S&P 500 Index | 10.57% | 3.17B |
| iShares 20+ Year Treasury Bond BuyWrite Strategy ETF(TLTW.US) | 20+ Year Treasury | 13.44% | 1.82B |
| YieldMax NVDA Option Income Strategy ETF(NVDY.US) | Nvidia | 71.35% | 1.31B |
| GLOBAL X FDS RUSSELL 2000 COVERED CALL ETF(RYLD.US) | Russell 2000 | 11.58% | 1.31B |
| YieldMax TSLA Option Income Strategy ETF(TSLY.US) | Tesla | 69.05% | 0.95B |
| YieldMax COIN Option Income Strategy ETF(CONY.US) | Coinbase | 203.5% | 0.40B |
Data Source: Sahm, Bloomberg Terminal; As of March 3, 2026
- Operational Advantage: Compared to individual strategies, these ETFs are managed by Wall Street institutions using standardized processes. This ensures disciplined execution and avoids errors caused by lack of experience or emotional trading.
- Cost Advantage: Most of these ETFs hold diversified index components, naturally spreading single-stock risk, and significantly lower transaction costs and tax burdens through bulk operations.
- Liquidity Advantage: In extreme market conditions, these ETFs ensure effective strategy execution, avoiding the "black swan" liquidity crises individual investors might face with concentrated positions.
Risk Warning:
- Strategy Limitation: Covered Calls may underperform the broader market in a bull run, missing out on explosive growth.
- Market Volatility: If the market continues to fall, option income may not fully offset losses, and net asset value still faces downside risk.
- Tax Impact: Option income is taxed at ordinary income rates, which may lower net returns.
Will you consider following the "smart money" into JPMORGAN EQUITY PREMIUM INCOME ETF(JEPI.US)? Is the U.S. stock market in a sideways "monkey market" or a bull run this year? Let us know in the comments!