Johnson & Johnson (JNJ) Valuation After Strong Q4 Results And US$100b 2026 Growth Ambitions
Johnson & Johnson JNJ | 243.04 | -0.44% |
Johnson & Johnson (JNJ) is back in focus after reporting better than expected fourth quarter results, setting a US$100b 2026 sales goal, and releasing new OMNY AF atrial fibrillation data that highlights its MedTech pipeline.
That backdrop of strong fourth quarter numbers and new clinical data has coincided with a clear shift in sentiment, with a 30 day share price return of 17.42% and a 1 year total shareholder return of 61.53% pointing to firmly building momentum.
If the recent healthcare news has your attention, it could be a good time to see what else is moving in the sector through our screener of 26 healthcare AI stocks.
With the share price sitting near all time highs and recent returns far outpacing the broader healthcare sector, the key question now is whether Johnson & Johnson still trades at an attractive discount or if markets are already pricing in its future growth?
Most Popular Narrative: 38.3% Overvalued
According to the most followed narrative on Johnson & Johnson, the fair value sits well below the last close of $239.99, pointing to a rich valuation against that framework.
Extending my 22x PE estimate to 2029, with a net income estimate of $24B, I get a future value of $528B, around $230 per share for JNJ. Discounting back to today using Simply Wall St’s 5.8% rate, I get a new present value of $174 per share, which is $5 higher than my prior valuation estimate.
Curious what sits behind that $174 figure, when the market is closer to $240? The narrative leans on steady revenue compounding, firm margins, and a confident earnings multiple to bridge that gap.
Result: Fair Value of $174 (OVERVALUED)
However, this thesis could be pressured if key lawsuits result in heavier than expected settlements or if late stage drugs fall short of commercial expectations.
Another View: Multiples Point to a Different Story
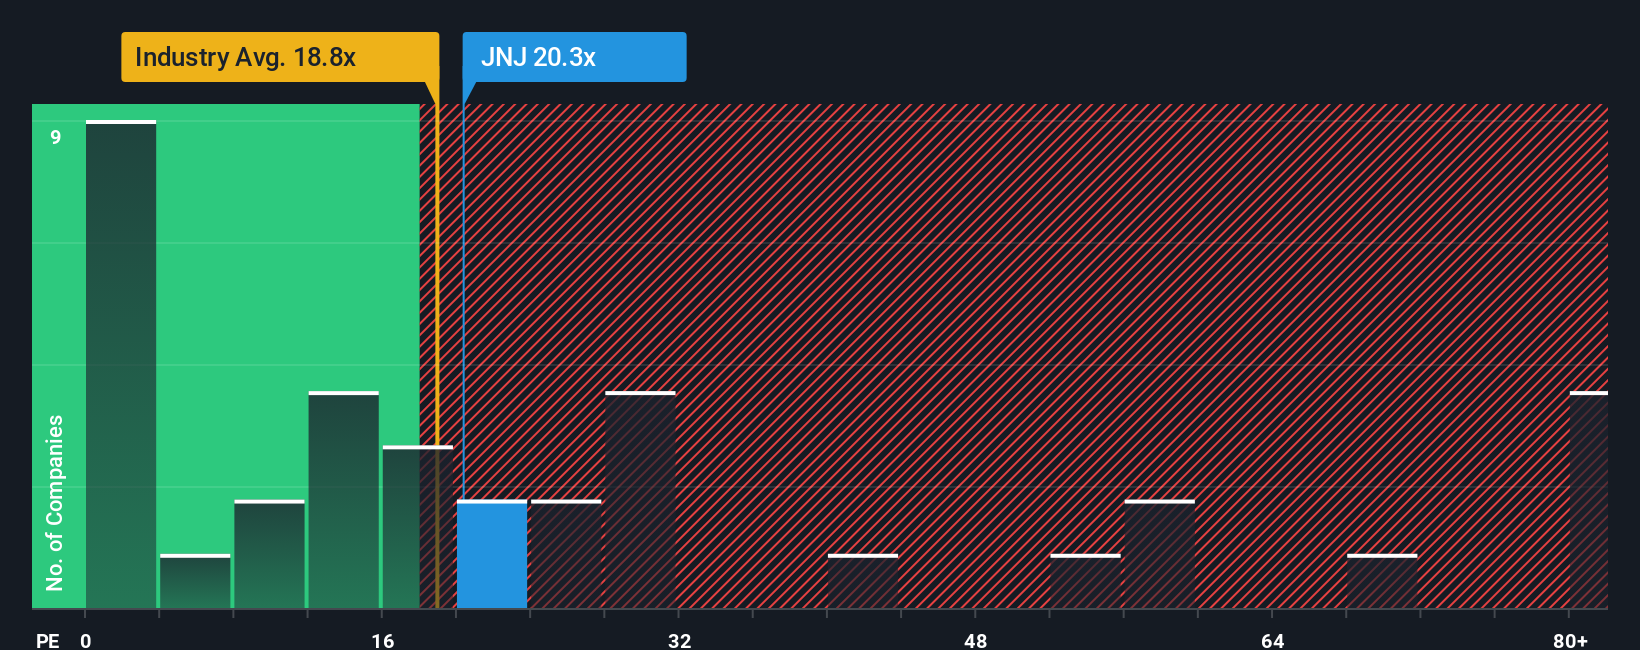
That 38.3% overvalued narrative leans heavily on a 22x P/E and a specific earnings path. Our data using a single earnings multiple paints a different picture, with JNJ trading on a 21.6x P/E versus a fair ratio of 30.7x and a peer average of 25.1x.
In plain terms, the stock sits slightly above the US Pharmaceuticals industry average but below both peers and the fair ratio that the market could move towards. This suggests more valuation risk-cut than excess in this framework. With two methods pointing in opposite directions, which one do you think better reflects the risks you care about most?
Build Your Own Johnson & Johnson Narrative
If you interpret the numbers differently or want to test your own assumptions, you can build a custom view in just a few minutes with Do it your way.
A great starting point for your Johnson & Johnson research is our analysis highlighting 3 key rewards and 2 important warning signs that could impact your investment decision.
Ready for more investment ideas beyond JNJ?
If this has sharpened your thinking on JNJ, do not stop here. Broaden your watchlist with other ideas that could fit your style and risk comfort.
- Target potential mispricing by scanning companies our screener flags as 52 high quality undervalued stocks so you can compare JNJ against businesses that currently look cheaper on the numbers.
- Secure your income stream by reviewing our list of 14 dividend fortresses if reliable cash returns are a key part of how you build a portfolio.
- Protect your downside by checking companies in the 82 resilient stocks with low risk scores so you are not relying on a single stock for resilience when conditions change.
This article by Simply Wall St is general in nature. We provide commentary based on historical data and analyst forecasts only using an unbiased methodology and our articles are not intended to be financial advice. It does not constitute a recommendation to buy or sell any stock, and does not take account of your objectives, or your financial situation. We aim to bring you long-term focused analysis driven by fundamental data. Note that our analysis may not factor in the latest price-sensitive company announcements or qualitative material. Simply Wall St has no position in any stocks mentioned.