June 2026's Top Dividend Stocks To Consider
EOG Resources, Inc. EOG | 0.00 |
Over the last 7 days, the United States market has experienced a 2.5% decline, yet it remains up by 19% over the past year with earnings forecast to grow by 18% annually. In light of these conditions, identifying dividend stocks that offer stable returns and potential for growth can be an effective strategy for investors seeking reliable income streams.
Top 10 Dividend Stocks In The United States
| Name | Dividend Yield | Dividend Rating |
| Peoples Bancorp (PEBO) | 4.36% | ★★★★★☆ |
| OTC Markets Group (OTCM) | 5.78% | ★★★★★★ |
| Korn Ferry (KFY) | 3.05% | ★★★★★☆ |
| Huntington Bancshares (HBAN) | 3.49% | ★★★★★☆ |
| First Interstate BancSystem (FIBK) | 4.87% | ★★★★★★ |
| Ennis (EBF) | 4.57% | ★★★★★★ |
| Columbia Banking System (COLB) | 4.60% | ★★★★★★ |
| Coca-Cola FEMSA. de (KOF) | 4.13% | ★★★★★☆ |
| Bladex (BLX) | 4.42% | ★★★★★☆ |
| Accenture (ACN) | 5.05% | ★★★★★★ |
We're going to check out a few of the best picks from our screener tool.
EOG Resources (EOG)
Simply Wall St Dividend Rating: ★★★★☆☆
Overview: EOG Resources, Inc. is involved in the exploration, development, production, and marketing of crude oil, natural gas liquids, and natural gas across the United States, Trinidad and Tobago, and internationally with a market cap of $70.63 billion.
Operations: EOG Resources generates revenue primarily from its crude oil and natural gas exploration and production segment, amounting to $23.57 billion.
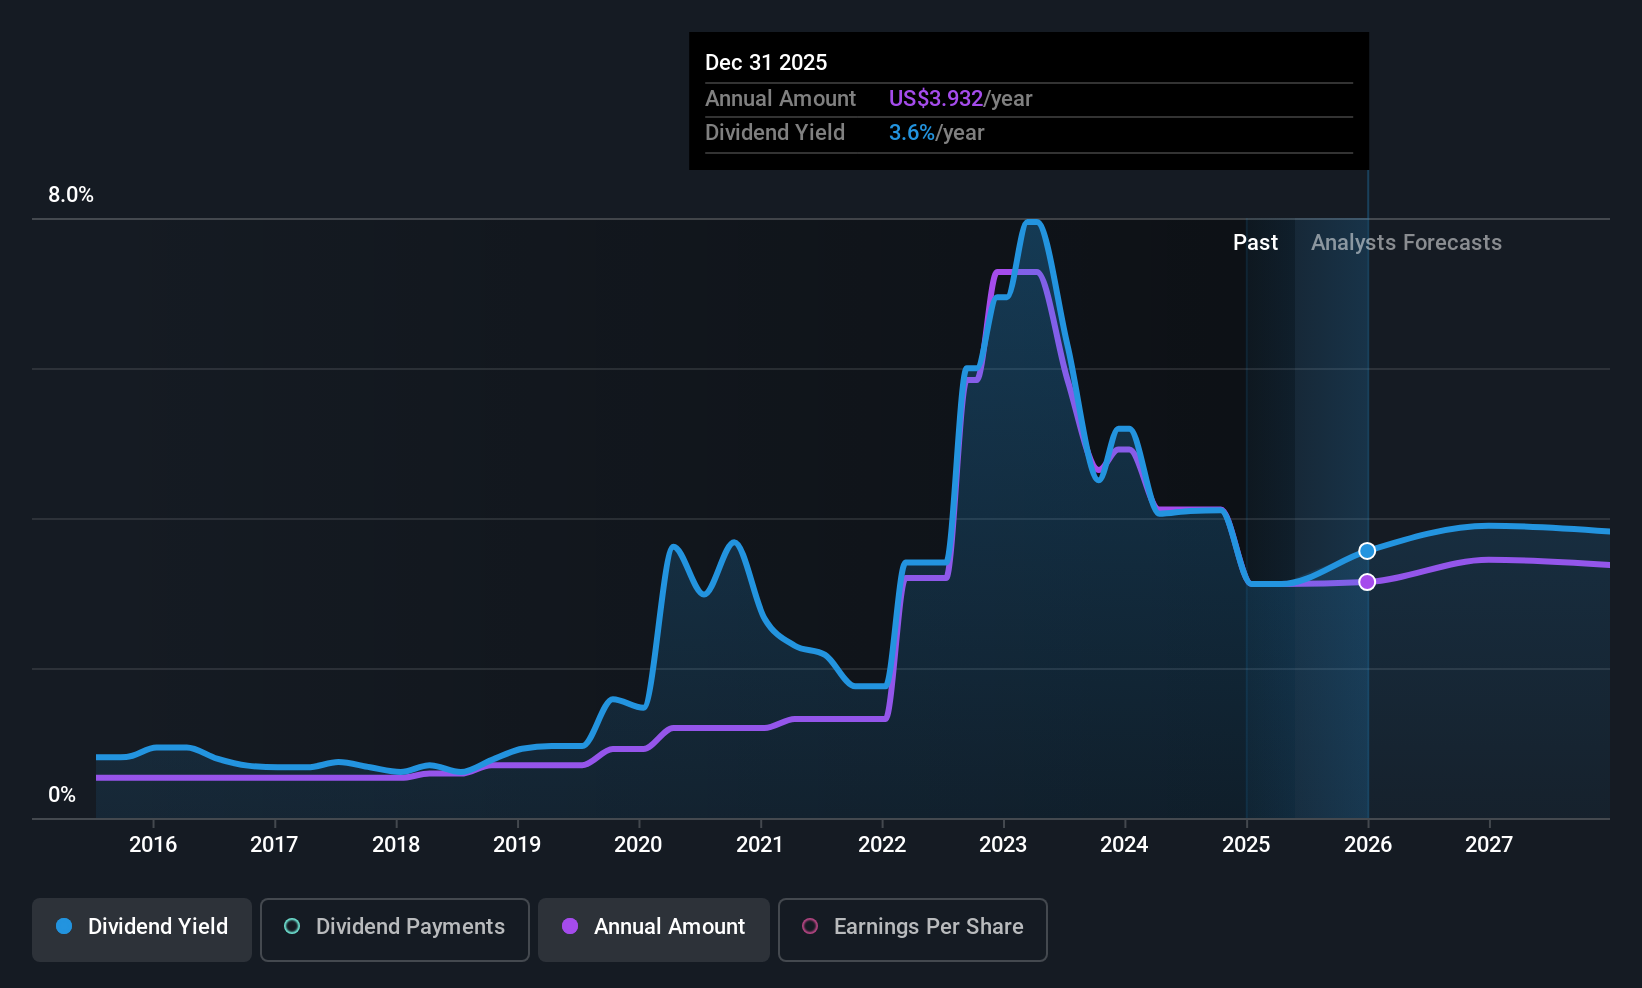
Dividend Yield: 3.1%
EOG Resources' dividend payments are well-covered by earnings and cash flows, with a payout ratio of 39.5% and a cash payout ratio of 54.8%. However, the dividend track record has been unstable over the past decade, experiencing volatility and significant annual drops. Despite trading at good value relative to peers, its current dividend yield of 3.08% is lower than the top quartile of US dividend payers. Recent events include an increased buyback plan but removal from the Russell 1000 Dynamic Index.
Exxon Mobil (XOM)
Simply Wall St Dividend Rating: ★★★★☆☆
Overview: Exxon Mobil Corporation is involved in the exploration and production of crude oil and natural gas across the United States, Canada, and globally, with a market capitalization of approximately $565.88 billion.
Operations: Exxon Mobil's revenue is primarily derived from its Upstream operations in the United States ($52.02 billion) and internationally ($49.79 billion), Energy Products in the United States ($122.15 billion) and abroad ($173.63 billion), as well as Chemical Products in the U.S. ($14.34 billion) and internationally ($18.30 billion), alongside Specialty Products within the U.S. ($7.59 billion) and globally ($12.79 billion).
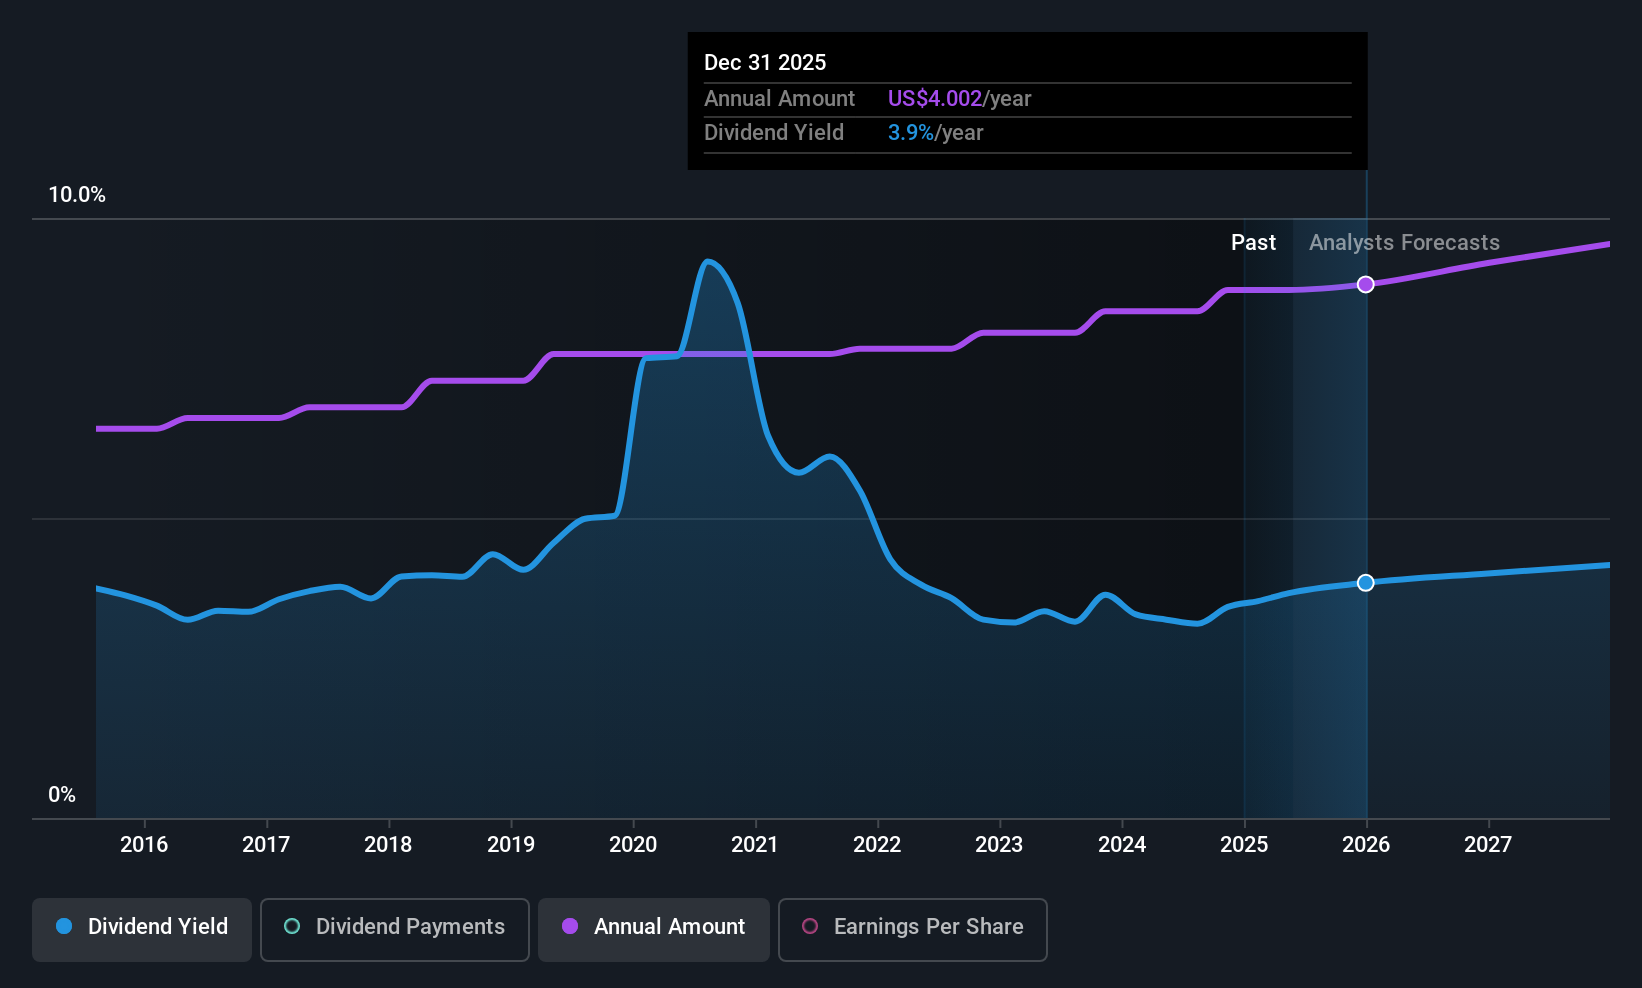
Dividend Yield: 3%
Exxon Mobil's dividends have been stable and reliable over the past decade, with payments growing consistently. However, its 3.02% yield is lower than the top US dividend payers, and dividends are not well-covered by free cash flows due to a high cash payout ratio of 90.9%. Recent developments include being dropped from the Russell 1000 Dynamic Index and engaging in debt financing activities with Sable Offshore Corp., which may impact financial flexibility.
Full Truck Alliance (YMM)
Simply Wall St Dividend Rating: ★★★★☆☆
Overview: Full Truck Alliance Co. Ltd. operates a digital freight platform connecting shippers with truckers for various shipments in China and Hong Kong, with a market cap of approximately $8.01 billion.
Operations: Full Truck Alliance Co. Ltd. generates its revenue primarily from its Internet Information Providers segment, amounting to CN¥12.64 billion.
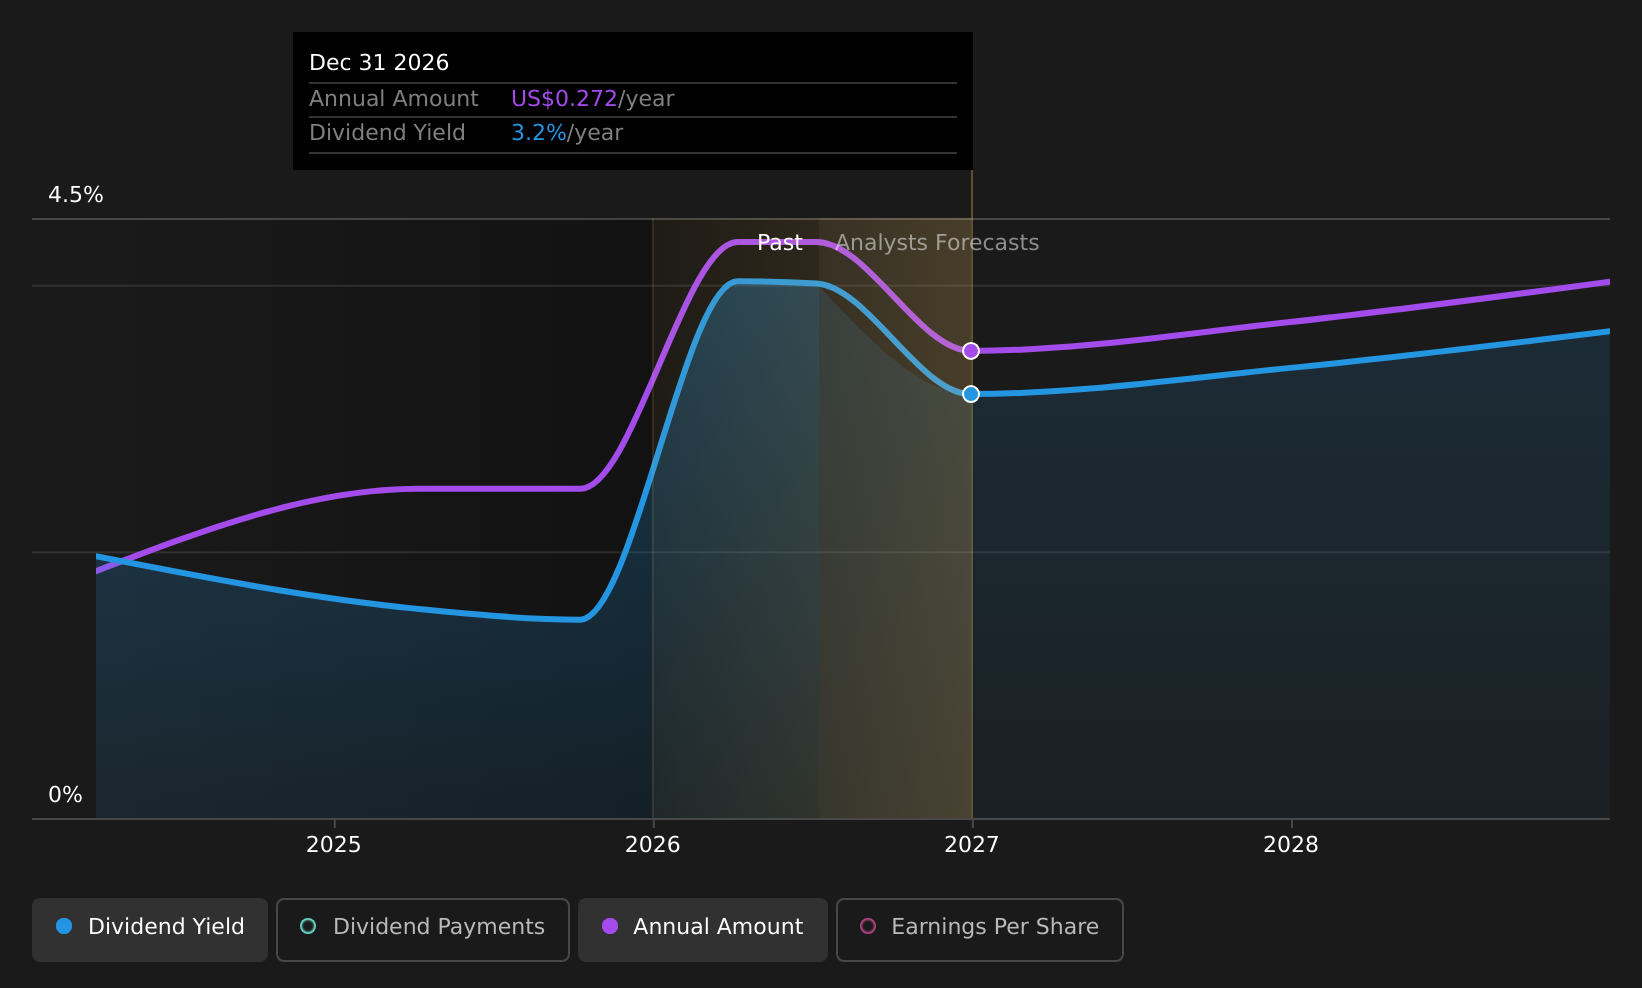
Dividend Yield: 4.3%
Full Truck Alliance's dividend yield of 4.33% ranks in the top 25% of US payers, with stable payments despite a short history. The dividend is well-covered by earnings (31.5% payout ratio) and cash flows (41.3% cash payout ratio), suggesting sustainability. Recent guidance indicates potential revenue growth, while a $50 million share buyback plan for 2026 reflects confidence in financial health, though dividends have only been paid for two years so far.
Taking Advantage
- Investigate our full lineup of 95 Top US Dividend Stocks right here.
- Are these companies part of your investment strategy? Use Simply Wall St to consolidate your holdings into a portfolio and gain insights with our comprehensive analysis tools.
- Enhance your investing ability with the Simply Wall St app and enjoy free access to essential market intelligence spanning every continent.
Seeking Other Investments?
- Explore high-performing small cap companies that haven't yet garnered significant analyst attention.
- Fuel your portfolio with companies showing strong growth potential, backed by optimistic outlooks both from analysts and management.
- Find companies with promising cash flow potential yet trading below their fair value.
This article by Simply Wall St is general in nature. We provide commentary based on historical data and analyst forecasts only using an unbiased methodology and our articles are not intended to be financial advice. It does not constitute a recommendation to buy or sell any stock, and does not take account of your objectives, or your financial situation. We aim to bring you long-term focused analysis driven by fundamental data. Note that our analysis may not factor in the latest price-sensitive company announcements or qualitative material. Simply Wall St has no position in any stocks mentioned.