

KLA (KLAC) Rides The AI Chip Rally, Is The Upside Already Priced In?
KLA KLAC | 0.00 |
The latest move in KLA (KLAC) stock comes as chipmakers rally on renewed interest in artificial intelligence infrastructure, with dip buyers returning after a recent selloff and early earnings reports improving overall sentiment.
Despite the recent pullback, with a 30 day share price return down 20.24% and a 7 day share price return down 4.37%, KLA still sits on a year to date share price return of 68.45% and a very large 5 year total shareholder return. This suggests that long term momentum remains strong even as sentiment cools ahead of earnings and sector valuation debates.
If renewed interest in AI infrastructure has you looking beyond a single stock, this is a good moment to scan the wider opportunity set through the 54 AI infrastructure stocks
Bulls see KLA’s pullback and continued AI demand as support for paying up, while bears point to a low value score and rich expectations. Which side does the current valuation evidence favor?
Most Popular Narrative: 7.6% Undervalued
On the latest close of $214.69, the most followed KLA narrative is anchored on a fair value of $232.43, framing recent volatility against long term AI driven demand assumptions.
The advanced packaging market is experiencing early stage, secular growth fueled by adoption of 2.5D/3D architectures and HBM, driving KLA's advanced packaging revenue target for 2025 up nearly 80% year over year with expectations that this trend is "closer to the beginning than the end"; this directly expands KLA's addressable market and should provide multi year upside to revenue.
Want to understand why this KLA story supports a higher fair value than the current price? The narrative leans on strong top line expansion, rising margins and a richer earnings multiple tied to AI focused demand. The exact growth path and profit profile behind those assumptions are where things get interesting.
Result: Fair Value of $232.43 (UNDERVALUED)
However, KLA’s story can change quickly if demand from China weakens further, or if global tariffs and rising costs squeeze margins more than analysts currently factor in.
Another View: KLA Through a Cash Flow Lens
The analyst narrative presents KLA as about 7.6% undervalued at $232.43, but the SWS DCF model provides a very different perspective, with an estimate of $86.99. That implies KLA is trading well above its modeled future cash flows. The question is which signal should carry more weight for you.
For a closer look at how those long term cash assumptions are built and stressed, take a moment to review the Look into how the SWS DCF model arrives at its fair value.
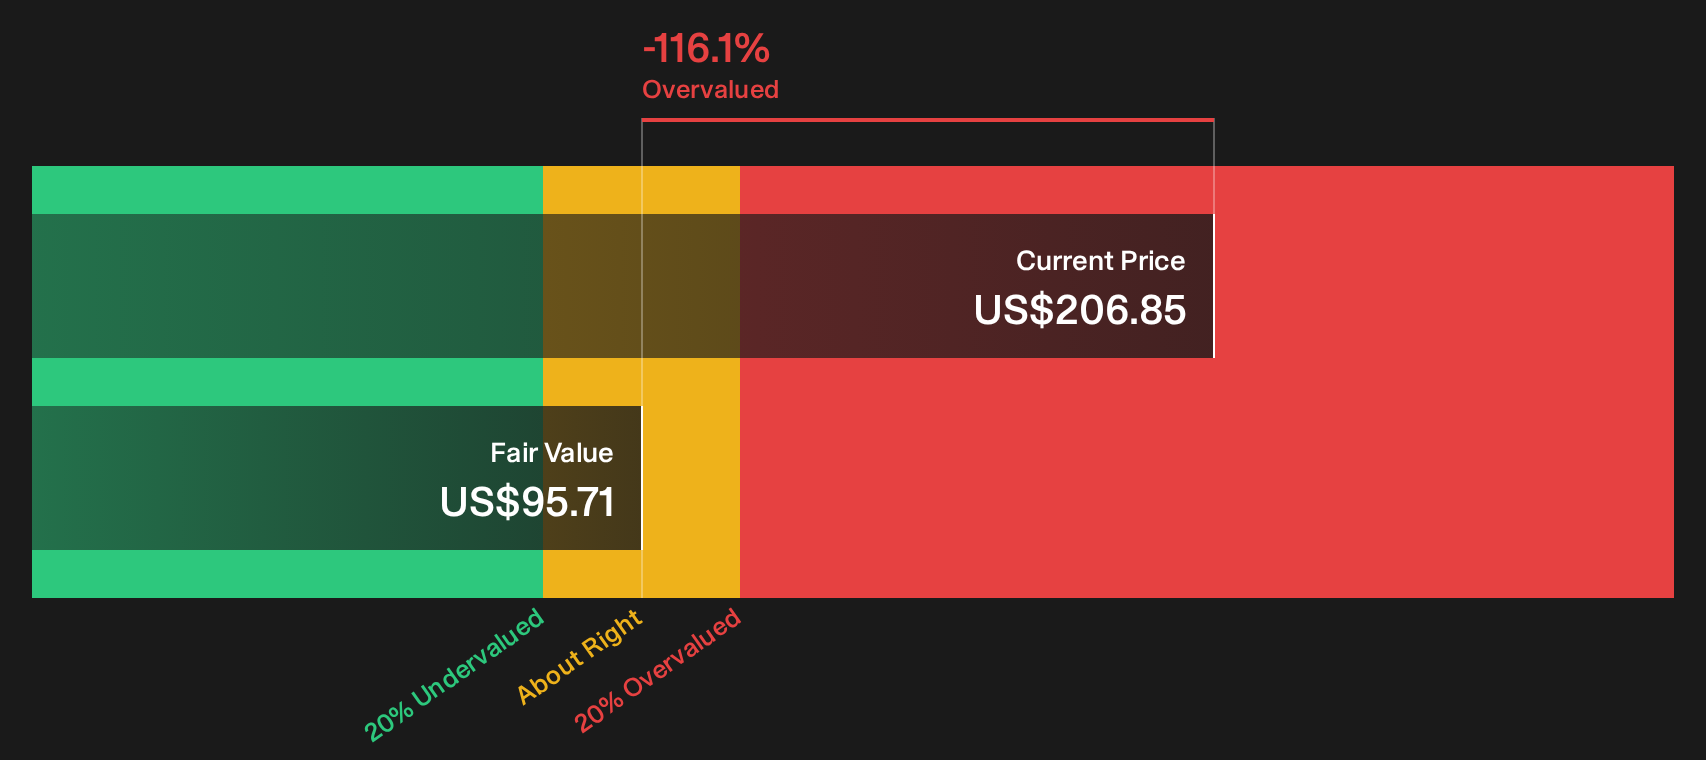
Simply Wall St performs a discounted cash flow (DCF) on every stock in the world every day (check out KLA for example). We show the entire calculation in full. You can track the result in your watchlist or portfolio and be alerted when this changes, or use our stock screener to discover 47 high quality undervalued stocks. If you save a screener we even alert you when new companies match - so you never miss a potential opportunity.
Next Steps
With KLA presenting both risk flags and appealing strengths, this is the moment to move quickly, test the numbers yourself, and weigh both sides using the 3 key rewards and 2 important warning signs
Looking for more investment ideas beyond KLA?
If KLA has your attention, do not stop there. Broaden your watchlist with a few focused stock ideas that could help you think about risk and return.
- Explore ambitious growth potential by scanning 21 elite penny stocks with strong financials that pair smaller market caps with financial profiles that may differ from common expectations.
- Search for quality at a sensible price using the 47 high quality undervalued stocks and compare how these stocks stack up against KLA on fundamentals.
- Emphasize resilience by reviewing the 82 resilient stocks with low risk scores for companies that score well on stability and financial strength.
This article by Simply Wall St is general in nature. We provide commentary based on historical data and analyst forecasts only using an unbiased methodology and our articles are not intended to be financial advice. It does not constitute a recommendation to buy or sell any stock, and does not take account of your objectives, or your financial situation. We aim to bring you long-term focused analysis driven by fundamental data. Note that our analysis may not factor in the latest price-sensitive company announcements or qualitative material. Simply Wall St has no position in any stocks mentioned.