Ladder Capital (LADR) Valuation Check After Recent Share Price Weakness
Ladder Capital Corp. Class A LADR | 9.97 9.97 | -0.10% 0.00% Pre |
Ladder Capital (LADR) has been drawing attention after recent share performance, with a one-month return of a 5.7% decline and a past three-month return of an 11.9% decline, prompting closer scrutiny of its fundamentals.
At a share price of $9.78, Ladder Capital’s recent 1 day and 7 day share price returns have been positive, but the 30 day and year to date share price returns remain negative, while multi year total shareholder returns are positive. This suggests that recent momentum has faded compared with longer term outcomes.
If this shift in momentum has you thinking about where else value or growth might emerge next, it could be a useful time to scan the market using the 20 top founder-led companies
With Ladder Capital trading at $9.78 against an analyst price target of $12.43 and an indicated intrinsic premium, is the market overlooking value here, or already factoring in the company’s recent growth in revenue and net income?
Price to Earnings of 19.4x: Is it justified?
Ladder Capital is trading on a P/E of 19.4x, and based on the available checks this is higher than both its industry and peer benchmarks at the current share price of $9.78.
The P/E multiple reflects how much investors are paying for each dollar of current earnings, which is especially important for a mortgage REIT where earnings can fluctuate with credit conditions, funding costs and real estate cycles. With net profit margins at 29.8% compared with 39.9% last year and a low current return on equity of 4.3%, a higher multiple suggests the market is placing meaningful weight on future earnings rather than recent profitability.
Relative to the US Mortgage REITs industry average P/E of 8.7x and a peer average of 17.2x, Ladder Capital’s 19.4x stands at a clear premium. Against an estimated fair P/E of 12.6x, the current valuation is also above the level that some models suggest the market could eventually move toward if expectations and earnings trends normalize.
Result: Price-to-Earnings of 19.4x (OVERVALUED)
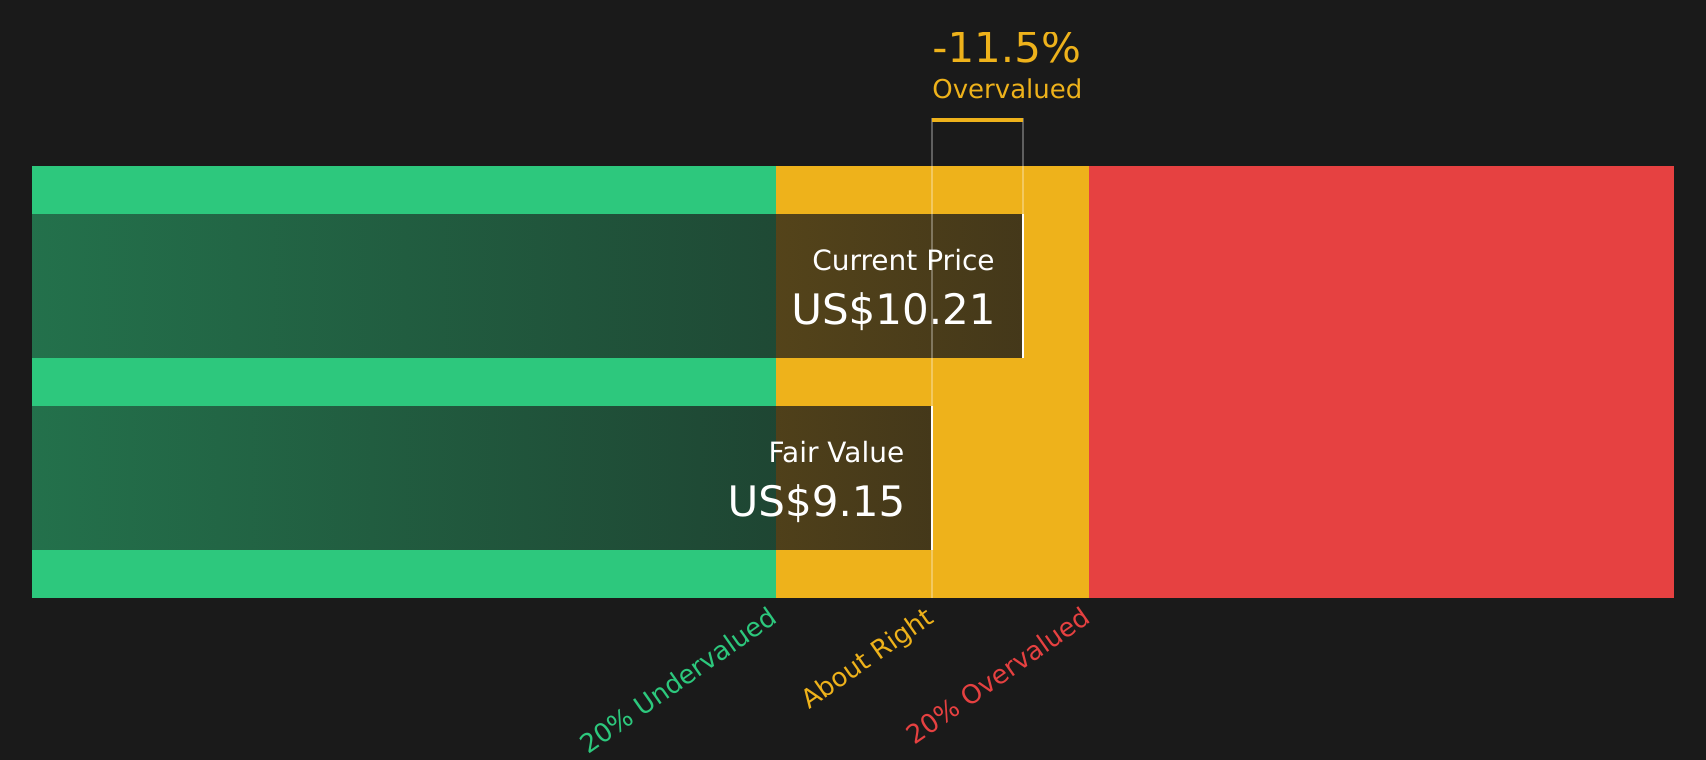
Alongside the multiples view, the SWS DCF model estimates a future cash flow value of $8.56 per share, compared with the latest close of $9.78, which points to the shares trading above that model’s fair value estimate. The DCF framework projects future cash flows for Ladder Capital’s real estate and lending activities and discounts them back to today using a required return, which helps translate long term forecasts into a single number.
For a mortgage REIT with forecast revenue growth of 11.9% per year and expected earnings growth of 22.4% per year, analysts’ assumptions about loan performance, funding costs and reinvestment rates can have a meaningful impact on that DCF output, even when the current year showed a 40.7% earnings decline and lower profit margins. That mix of improving long term forecasts and weaker recent results helps explain why the model value of $8.56 sits below the market price of $9.78 despite growth expectations that are higher than the broader US market.
However, you still need to weigh risks such as weaker loan performance or shifts in commercial real estate values, which could challenge earnings assumptions underpinning current valuations.
Another View: Cash Flows Point to a Different Story
While the 19.4x P/E suggests Ladder Capital is expensive, the SWS DCF model adds another layer. In this view, the estimated future cash flow value of $8.56 per share is below the current $9.78 price, which points to limited upside if those cash flow assumptions hold.
Simply Wall St performs a discounted cash flow (DCF) on every stock in the world every day (check out Ladder Capital for example). We show the entire calculation in full. You can track the result in your watchlist or portfolio and be alerted when this changes, or use our stock screener to discover 59 high quality undervalued stocks. If you save a screener we even alert you when new companies match - so you never miss a potential opportunity.
Next Steps
With mixed signals across valuation, earnings and cash flow, the picture is hardly one sided. It makes sense to review the details yourself, decide where you stand quickly, then lean on the 2 key rewards and 2 important warning signs
Looking for more investment ideas?
If Ladder Capital has sharpened your thinking, do not stop here. Use focused screens to spot other opportunities that could fit your goals before they move.
- Target stronger pricing power and potential upside with the 59 high quality undervalued stocks.
- Lock in the kind of income stream you actually notice by scanning for reliable payers through the 13 dividend fortresses.
- Zero in on quality names that many investors overlook by running the screener containing 25 high quality undiscovered gems.
This article by Simply Wall St is general in nature. We provide commentary based on historical data and analyst forecasts only using an unbiased methodology and our articles are not intended to be financial advice. It does not constitute a recommendation to buy or sell any stock, and does not take account of your objectives, or your financial situation. We aim to bring you long-term focused analysis driven by fundamental data. Note that our analysis may not factor in the latest price-sensitive company announcements or qualitative material. Simply Wall St has no position in any stocks mentioned.