

Lennar (LEN) Looks Fully Valued Following Russell Defensive Index Removal
Lennar Corporation Class A LEN | 0.00 |
Index removals and dividend decision put Lennar back in focus
Lennar (LEN) has been removed from the Russell 1000 Defensive Index and the Russell 1000 Value-Defensive Index for both its Class A and Class B shares, a change that can influence institutional trading flows.
This index reclassification comes just days after Lennar’s board affirmed a quarterly cash dividend of US$0.50 per share on both classes of stock, maintaining its regular cash return to shareholders.
Lennar’s recent index removals appear alongside a share price of US$88.21, with the stock down 15.36% on a year to date share price basis and its 1 year total shareholder return declining 18.77%. This suggests momentum has been fading despite the affirmed dividend.
If you are reassessing housing related exposure after Lennar’s index changes, it could be a good moment to broaden your search and check out 20 top founder-led companies
With Lennar now trading close to its analyst price target and a share price that has declined over 1 year, the key question is whether today’s level reflects undervaluation or whether the market is already pricing in future growth.
Most Popular Narrative: 0.4% Undervalued
With Lennar’s fair value estimate of $88.54 sitting almost exactly on the last close of $88.21, the current pricing tightly tracks the most followed narrative’s math.
Lennar's transition to an asset light, land light model with just in time delivery is expected to generate more predictable volume and growth, reducing the asset base and risk profile while improving cash flow, thus enhancing future revenue and net margin potential.
Want to see what that land light shift really assumes for Lennar? The core narrative leans heavily on volume, slimmer margins, and a tighter share count. Curious which numbers are doing the heavy lifting behind that near perfect fair value match?
Result: Fair Value of $88.54 (ABOUT RIGHT)
However, Lennar’s story can change quickly if higher mortgage rates keep demand subdued or if land banking costs and buyer incentives squeeze margins more than analysts expect.
Another View: Lennar Through a Cash Flow Lens
The fair value narrative for Lennar based on earnings and price targets looks finely balanced, but the SWS DCF model paints a different picture. On that cash flow view, Lennar at $88.21 is priced well above an estimated future cash flow value of $43.24, which implies the market is placing a much higher value on the stock than this model supports.
For you as an investor, that kind of gap can signal valuation risk if cash flows do not build as the market expects, or can simply show how sensitive Lennar is to small changes in long term assumptions. Which version of the story appears closer to how you see the next decade for this homebuilder?
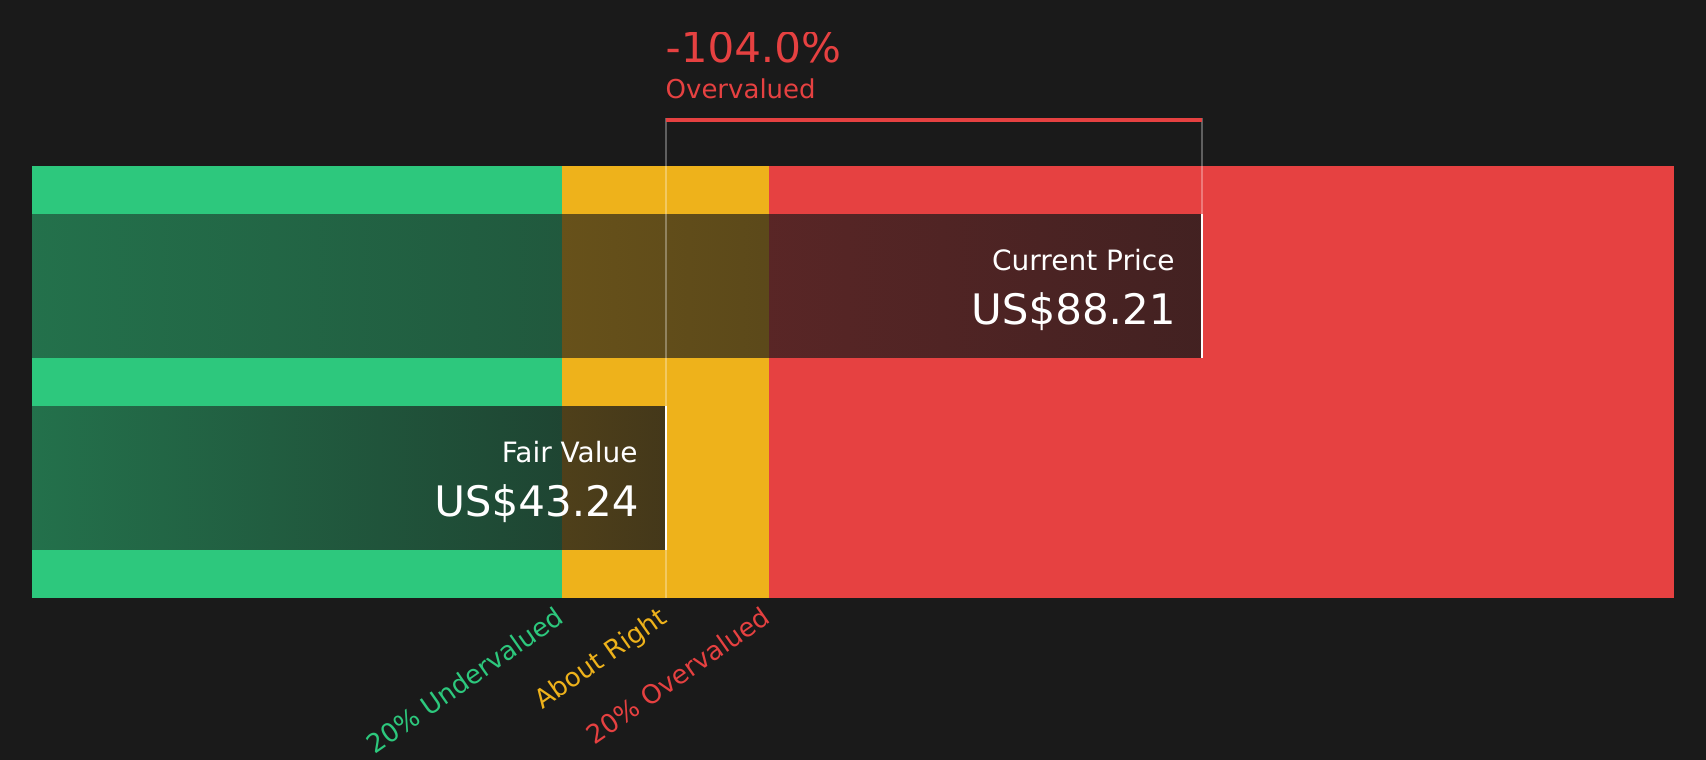
Simply Wall St performs a discounted cash flow (DCF) on every stock in the world every day (check out Lennar for example). We show the entire calculation in full. You can track the result in your watchlist or portfolio and be alerted when this changes, or use our stock screener to discover 44 high quality undervalued stocks. If you save a screener we even alert you when new companies match - so you never miss a potential opportunity.
Next Steps
If the mixed signals around Lennar have you on the fence, take a moment to review both sides and decide quickly where you stand by weighing 4 key rewards and 1 important warning sign
Looking for more investment ideas beyond Lennar?
Do not stop with Lennar. If you want a fuller picture of what is out there, broaden your watchlist now using focused stock ideas built from clear fundamentals.
- Target resilient income by scanning companies that meet the 7 dividend fortresses and see which yields stand out versus their financial profile.
- Spot potential mispricings early by reviewing companies in the screener containing 18 high quality undiscovered gems before they sit on everyone else's radar.
- Prioritise stability by filtering for companies in the 74 resilient stocks with low risk scores and compare how their risk scores line up with your tolerance.
This article by Simply Wall St is general in nature. We provide commentary based on historical data and analyst forecasts only using an unbiased methodology and our articles are not intended to be financial advice. It does not constitute a recommendation to buy or sell any stock, and does not take account of your objectives, or your financial situation. We aim to bring you long-term focused analysis driven by fundamental data. Note that our analysis may not factor in the latest price-sensitive company announcements or qualitative material. Simply Wall St has no position in any stocks mentioned.