Long-Only Spread Trading Strategy Using Microsoft And Alphabet Stocks
In this article, we explore a quantitative approach to spread trading with a slightly different setup than the classic model.
Typically, spread trading involves going long on one asset and simultaneously shorting another to profit from temporary price divergences. In this case, however, we apply a long-only strategy, focusing exclusively on the long (buy) side.
The idea is to identify moments when two highly correlated stocks temporarily diverge, buying the relatively weaker one in anticipation of a return to the mean.
This approach still takes advantage of temporary inefficiencies between correlated assets in the same sector, but it avoids short selling altogether.
For this strategy, we selected Microsoft (MSFT) and Alphabet (GOOGL), two of the largest tech companies in the world. While their stock prices often move in tandem, they don’t always respond with equal intensity to market events. Periods where one lags behind the other can offer compelling entry points, based on the assumption of a future reversion in the spread.
How to Analyze the MSFT-GOOGL Spread
To evaluate the relationship between Microsoft and Alphabet, we create a time series representing the difference between their closing prices. This spread reflects how the two stocks deviate from or revert to each other over time, and becomes the foundation for our trading signals.
To detect when the spread is in an extreme condition (i.e., too far from its equilibrium), we apply Bollinger Bands directly to the spread. This allows the indicator to adjust dynamically to changes in volatility and highlights statistically abnormal divergences.
Figure 1 shows the spread (white line) between MSFT and GOOGL, along with the upper (red) and lower (green) Bollinger Bands. When the spread line touches or crosses one of the bands, it indicates that the relationship between the two stocks has deviated from its typical range.
Specifically, when the spread falls below the lower band, it means that Microsoft has temporarily underperformed Alphabet.

Figure 1. Spread behavior between MSFT and GOOGL with Bollinger Bands applied.
Long-Only Spread Trading Strategy Rules
We base the strategy on this observation, calculating 10-period Bollinger Bands with one standard deviation on the spread between the two stocks. The entry and exit rules are as follows:
- Entry (Long Only on MSFT): Enter when the spread crosses below the lower band (the white line drops below the green line). The trade is executed on the next bar. This signals that MSFT is excessively weak compared to GOOGL.
- Exit: Close the position when the spread crosses back above its 10-period moving average, indicating that the mean reversion has occurred. Again, the execution takes place on the next bar.
We apply the same logic and parameters (10 periods, 1 standard deviation) to the inverse spread (GOOGL – MSFT) to open long positions on GOOGL when it becomes the temporarily weaker stock. Figure 2 illustrates a typical trade: an entry occurs when the spread dips below the lower band, and an exit follows when it reverts above the moving average.

Figure 2. Example of a trade using the spread strategy.
Backtest Results and Strategy Performance
We backtested this strategy starting from 2010 using a hypothetical $10,000 per trade.
Figure 3 shows the equity curve combining trades on MSFT (using the MSFT-GOOGL spread) and on GOOGL (using the GOOGL-MSFT spread).
The performance appears extremely steady and consistently upward, with a linear progression of profits and no significant periods of deterioration. This suggests that the strategy has maintained a stable and coherent behavior over time, despite the various market conditions experienced over the past fifteen years.
As shown in Figure 4, the strategy executed a total of 455 trades, all on the long side, with a win rate of 63.3%.
The average trade of approximately $88 is a very encouraging result, as it is enough to cover operating costs (slippage and commissions) while still providing a positive net margin for each trade.
Figure 5 further highlights how the returns are well balanced between the two stocks.
Using the MSFT – GOOGL spread, the strategy generated a net profit of $17,392 across 223 trades, while the GOOGL – MSFT spread produced a net profit of $22,760 over 232 trades.
This symmetry in results demonstrates that the underlying logic is robust and does not rely on which stock is used as the reference.

Figure 3. Equity curve of the combined portfolio using both MSFT and GOOGL.
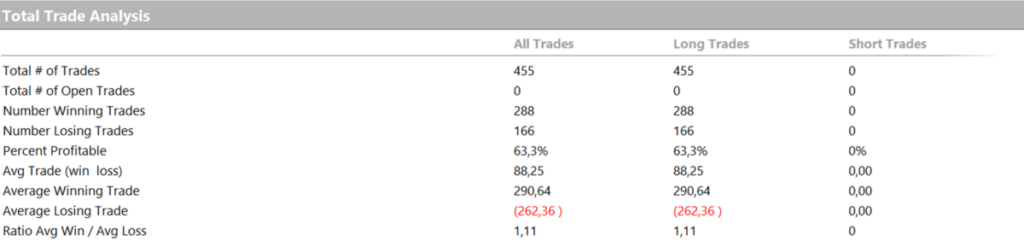
Figure 4. Total trade analysis of the portfolio.

Figure 5. Portfolio performance breakdown.
Conclusion: A Simplified Approach to Spread Trading
In this study, we explored how spread trading logic can be applied in a different way than usual.
Traditionally, this technique involves opening simultaneous long and short positions on two correlated instruments, with the goal of profiting from relative price fluctuations.
In the scenario analyzed here, however, the approach is unilateral: trades are placed only on the long side, buying the stock that is temporarily weaker than its counterpart, with the expectation of a return to equilibrium.
While this setup retains the core principles of spread trading, it is much easier to manage and is also well suited to portfolios focused solely on buying stocks.
The strategy does not require a complex structure or market-neutral exposure. Instead, it relies on a simple and objective mechanism: enter when the relationship between two stocks deviates abnormally, and exit when it reverts to the mean.
The results clearly show that even such a straightforward approach can generate stable and consistent returns over time, confirming that, in quantitative trading, simplicity is often one of the most powerful tools.
Until next time, happy trading!
Benzinga Disclaimer: This article is from an unpaid external contributor. It does not represent Benzinga’s reporting and has not been edited for content or accuracy.