Magnolia Oil & Gas (MGY) Margin Decline Tests Bullish Earnings Growth Narrative
Magnolia Oil & Gas Corp. Class A MGY | 31.93 31.90 | +2.80% -0.09% Post |
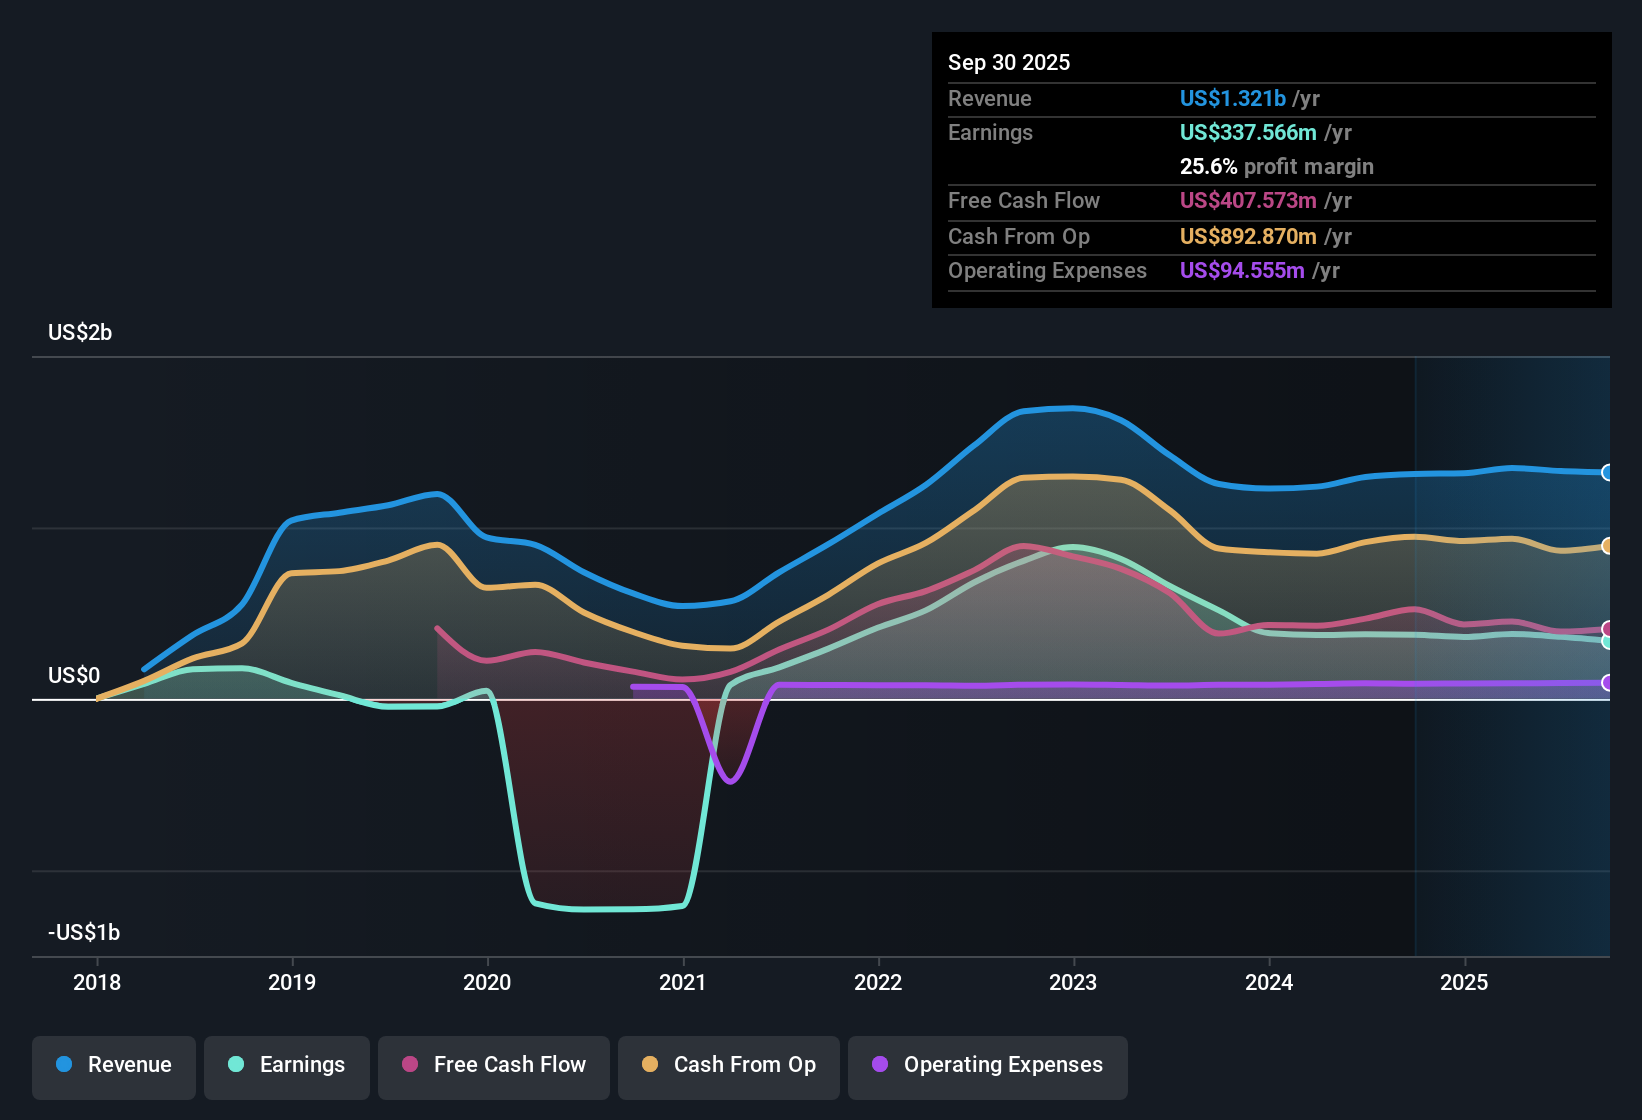
Magnolia Oil & Gas (MGY) has wrapped up FY 2025 with fourth quarter revenue of US$317.6 million and basic EPS of US$0.38, alongside net income of US$68.8 million, putting fresh numbers behind its latest earnings update. Over the past few quarters, the company has seen revenue move between US$318.0 million and US$350.3 million while quarterly basic EPS ranged from US$0.38 to US$0.54, with trailing twelve month EPS sitting at US$1.75 on revenue of about US$1.3 billion. With a trailing net profit margin of 24.8%, this set of results keeps the spotlight firmly on how sustainable those margins look from here.
See our full analysis for Magnolia Oil & Gas.With the headline numbers on the table, the next step is to see how they compare with the widely followed narratives around Magnolia Oil & Gas, and where those stories might need to be updated.
24.8% net margin on US$1.3b revenue
- On a trailing twelve month basis Magnolia turned US$1.3b of revenue into US$325.3 million of net income, which works out to a 24.8% net profit margin compared with 27.5% a year earlier in the dataset.
- What stands out for a bullish read is that this 24.8% margin comes alongside US$1.75 in trailing EPS and earnings quality described as high. Even with the margin lower than 27.5%, the company is still converting a sizeable slice of its revenue into profit.
- Trailing twelve month EPS moved between about US$1.75 and US$2.02 over recent quarters while net income ranged from US$325.3 million to US$378.9 million, which lines up with the idea of a business that has already shifted into consistent profitability over the last five years.
- Bulls who focus on cost control can point to average production costs per BOE sitting in a relatively tight band, from US$8.64 to US$9.45 over the last four quarters, as context for how that margin is being maintained.
EPS of US$1.75 and earnings growth story
- Trailing twelve month EPS for Magnolia is US$1.75, and the data shows earnings growth of about 10.4% per year recently, on top of roughly 15.6% per year over the past five years as the company moved into sustained profitability.
- Supporters of a bullish narrative argue that this kind of earnings track record, paired with US$325.3 million of trailing net income, gives the business room to keep building on its profit base even though margins have eased from 27.5% to 24.8%.
- The quarterly EPS prints across FY 2025, from US$0.38 to US$0.54, show that the full year US$1.75 is not reliant on a single unusually strong period, which aligns with the idea of an earnings profile that is less patchy than a typical early stage producer.
- At the same time, the fact that the margin in the latest trailing period is lower than a year ago gives bulls something to watch, because any further compression would start to push against that 10.4% earnings growth figure.
P/E of 15.2x versus DCF fair value gap
- Magnolia is trading on a trailing P/E of 15.2x at a share price of US$26.99, which is slightly above the US Oil & Gas industry average of 14.1x but below the peer average of 19.2x, and the dataset also shows a DCF fair value of US$65.44, roughly 58.8% above the current share price.
- Critics who take a more cautious angle often point out that paying a P/E above the broader industry for a company whose margin has eased to 24.8% demands confidence in that 10.4% earnings growth outlook, even if the gap between US$26.99 and the US$65.44 DCF fair value suggests meaningful upside in that particular model.
- The tension here is that the company screens as more expensive than the wider industry on P/E but cheaper than a closer peer set, so investors leaning bearish may question whether the peer group comparison or the broader industry reference should carry more weight.
- For anyone using valuation models, the contrast between a 15.2x trailing P/E and a DCF fair value that sits very far above the current share price is a reminder to look at how sensitive those models are to the same earnings and margin trends seen in the recent numbers.
Next Steps
Don't just look at this quarter; the real story is in the long-term trend. We've done an in-depth analysis on Magnolia Oil & Gas's growth and its valuation to see if today's price is a bargain. Add the company to your watchlist or portfolio now so you don't miss the next big move.
See What Else Is Out There
Magnolia Oil & Gas shows a lower net margin than a year ago and trades on a P/E above the broader industry, which could limit appeal for value focused investors.
If you are uneasy about paying up for that combination of softer margins and a richer multiple, check out our 53 high quality undervalued stocks to quickly zero in on companies that currently screen as cheaper on key metrics.
This article by Simply Wall St is general in nature. We provide commentary based on historical data and analyst forecasts only using an unbiased methodology and our articles are not intended to be financial advice. It does not constitute a recommendation to buy or sell any stock, and does not take account of your objectives, or your financial situation. We aim to bring you long-term focused analysis driven by fundamental data. Note that our analysis may not factor in the latest price-sensitive company announcements or qualitative material. Simply Wall St has no position in any stocks mentioned.