Main Street Capital (MAIN) Stock After Recent Pullback Is The Valuation Opportunity?
Main Street Capital Corporation MAIN | 0.00 |
- If you are wondering whether Main Street Capital is attractively priced right now, the key is to separate short term share moves from what the current valuation actually implies.
- The stock recently closed at US$50.02, with the share price down 2.8% over the past week, roughly flat over the past month at a 0.8% gain, and lower year to date and over 1 year, while still showing gains over 3 and 5 years.
- Recent coverage around Main Street Capital has focused on its role as a business development company, its income focused model, and how listed BDCs as a group are being assessed by income investors and fund managers. This backdrop provides useful context for the recent share price moves, as investors reassess income focused stocks and how they stack up against other yield options.
- On Simply Wall St's six point valuation checklist, Main Street Capital scores a 5 out of 6. The next step is to look at how different valuation approaches arrive at that result and then consider an even more complete way to think about value later in the article.
Approach 1: Main Street Capital Excess Returns Analysis
The Excess Returns model looks at how much profit Main Street Capital earns on its equity base above the return that shareholders require, then converts those surplus profits into an estimated intrinsic value per share.
For Main Street Capital, the model uses a Book Value of $33.46 per share and a Stable EPS estimate of $5.18 per share, based on the median return on equity from the past 5 years. The implied Cost of Equity is $2.83 per share, so the Excess Return comes out at $2.34 per share. This reflects an Average Return on Equity of 16.94% applied to a Stable Book Value of $30.57 per share, which is also based on the median book value over the past 5 years.
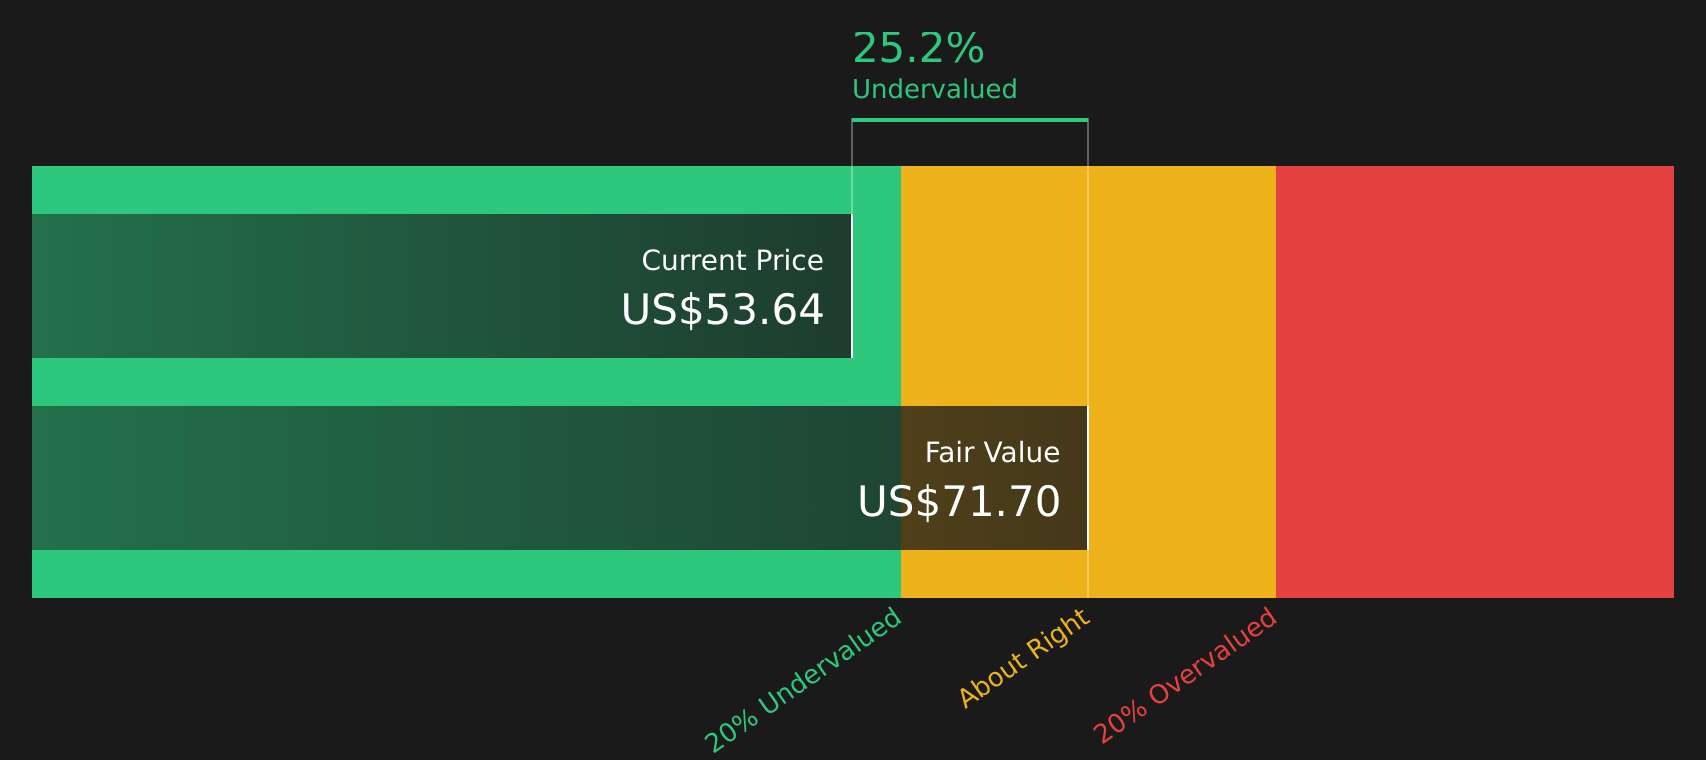
Feeding these inputs into the Excess Returns framework produces an estimated intrinsic value of about $71.47 per share. Compared with the recent share price of $50.02, the model suggests Main Street Capital trades at roughly a 30.0% discount. On this approach, the shares screen as undervalued.
Result: UNDERVALUED
Our Excess Returns analysis suggests Main Street Capital is undervalued by 30.0%. Track this in your watchlist or portfolio, or discover 44 more high quality undervalued stocks.
Approach 2: Main Street Capital Price vs Earnings
For profitable companies like Main Street Capital, the P/E ratio is a common way to think about what you are paying for each dollar of current earnings. It links directly to the company’s ability to generate profit today, which is especially relevant for income focused investors.
What counts as a “normal” or “fair” P/E generally reflects two things: how quickly earnings are expected to grow, and how risky those earnings appear. Higher expected growth and lower perceived risk can justify a higher P/E, while slower growth or higher risk usually point to a lower one.
Main Street Capital currently trades on a P/E of 10.91x. This sits well below the Capital Markets industry average of 40.52x and also below the peer group average of 17.00x. Simply Wall St’s Fair Ratio for Main Street Capital is 11.26x, a proprietary estimate of what the P/E “should” be after accounting for factors such as earnings growth, risk profile, profit margins, industry and market cap. Because this Fair Ratio is tailored to the stock rather than a broad group, it offers a more company specific anchor than simple peer or industry comparisons. With the Fair Ratio only slightly above the current P/E, the shares screen as about fairly valued on this metric.
Result: ABOUT RIGHT

P/E ratios tell one story, but what if the real opportunity lies elsewhere? Start investing in legacies, not executives. Discover our 20 top founder-led companies.
Upgrade Your Decision Making: Choose your Main Street Capital Narrative
Earlier it was mentioned that there is an even better way to understand valuation. Narratives are introduced here as a simple way for you to describe Main Street Capital’s story in your own words, link that story to a forecast for revenue, earnings and margins, convert that forecast into a Fair Value, and then compare that Fair Value with the current share price. All of this is available within an easy tool on Simply Wall St’s Community page that updates automatically when new news or earnings arrive. One investor might build a more cautious Main Street Capital Narrative that leans toward the lower analyst target of US$50.00 based on concerns around income fluctuations and credit quality. Another might create a more optimistic Narrative that lines up with the higher target of US$70.00 using the same shared data but different assumptions about future portfolio mix, profitability and P/E. This gives you a clear, structured way to decide how your view compares with both the market price and other investors’ expectations.
Do you think there's more to the story for Main Street Capital? Head over to our Community to see what others are saying!

This article by Simply Wall St is general in nature. We provide commentary based on historical data and analyst forecasts only using an unbiased methodology and our articles are not intended to be financial advice. It does not constitute a recommendation to buy or sell any stock, and does not take account of your objectives, or your financial situation. We aim to bring you long-term focused analysis driven by fundamental data. Note that our analysis may not factor in the latest price-sensitive company announcements or qualitative material. Simply Wall St has no position in any stocks mentioned.