Manchester United (MANU) Stock Could Be 39% Below Fair Value After Governance Criticism
Manchester United Plc Class A MANU | 0.00 |
Influential proxy advisers have publicly criticized Manchester United (NYSE:MANU) over board independence, the lack of a nominating committee, and limited disclosure of proxy voting results, putting the club’s governance practices in sharper focus for shareholders.
Manchester United’s recent governance scrutiny comes as the stock trades at US$21.90, with a 30 day share price return of 9.5% and a 90 day share price return of 32.17%. The 1 year total shareholder return is 15.32%, indicating that recent momentum has been positive even though some longer term total shareholder returns have been weaker.
If this governance story has you thinking more broadly about where you deploy capital next, it could be a good time to scan 20 top founder-led companies
With Manchester United trading at US$21.90 and sitting on a 38.78% year to date return, plus an intrinsic value estimate suggesting a sizeable discount, you have to ask: is there still an opening here, or is the market already pricing in future growth?
Preferred Price-to-Sales of 4.2x: Is it justified?
On Simply Wall St’s checks, Manchester United screens as good value relative to an intrinsic value estimate, yet its current price implies a rich revenue multiple. That tension sits at the heart of how you might interpret the US$21.90 share price.
The preferred metric here is the P/S ratio, which compares the company’s market value to its annual revenue. For Manchester United, that figure currently sits at 4.2x, meaning investors are paying US$4.20 in market value for every US$1 of revenue the club generates.
Against peers, that 4.2x P/S stands out. It is described as expensive versus the US Entertainment industry average of 1.2x and also above a peer group average of 2.2x. It is also well above an estimated “fair” P/S level of 2.1x, a level the market could potentially gravitate toward if expectations and sentiment shift over time.
Result: Price-to-Sales of 4.2x (OVERVALUED)
However, Manchester United still faces governance criticism and a recent annual net loss of £18.131 million, either of which could quickly shift how that 4.2x P/S is viewed.
Another view on Manchester United’s value
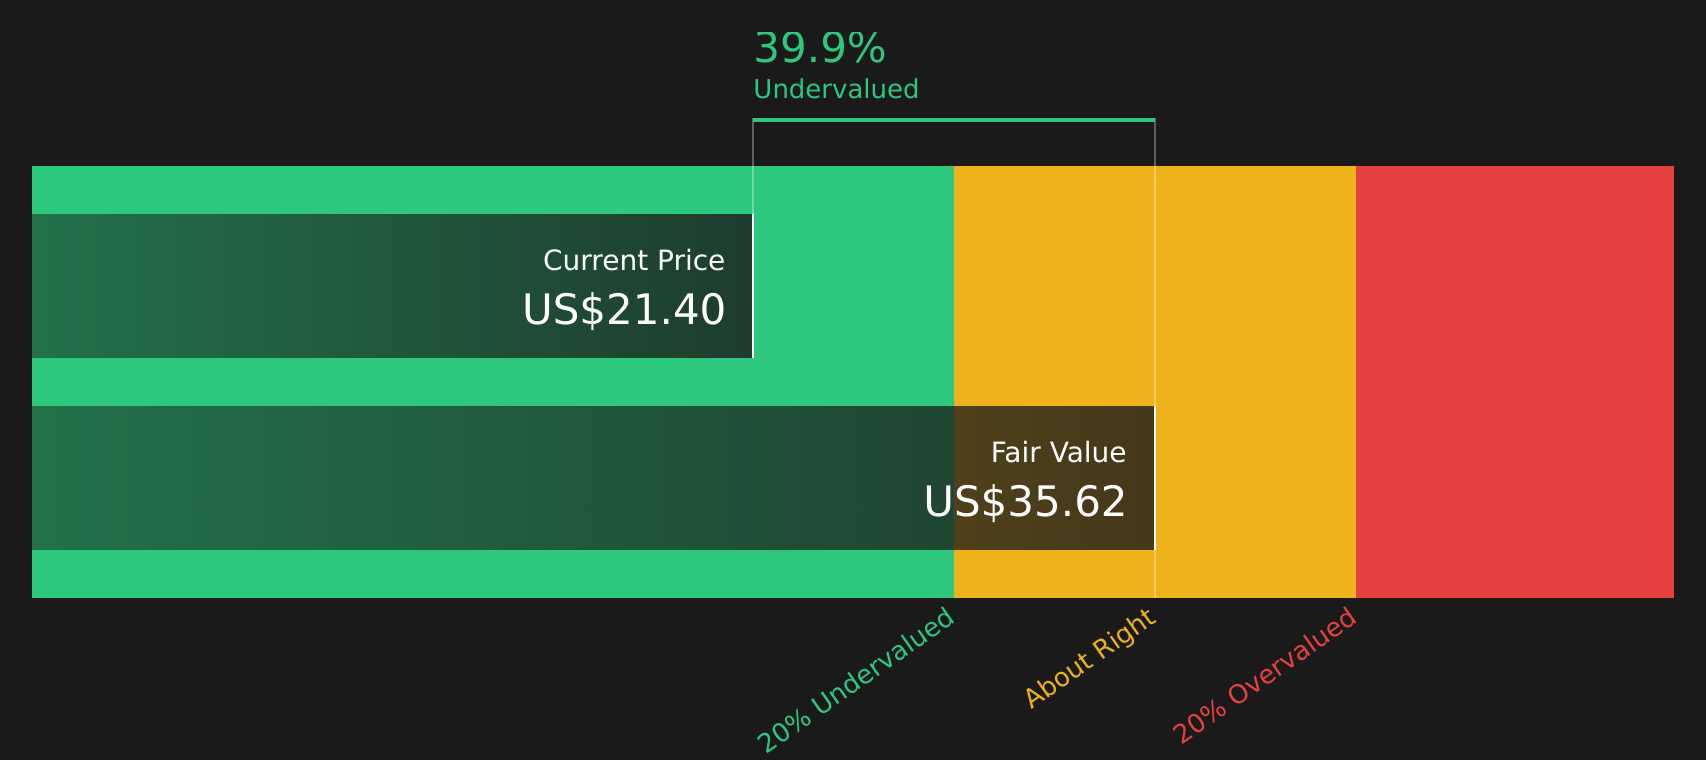
While the 4.2x P/S ratio makes Manchester United look expensive on revenue, our DCF model points the other way. With the stock at $21.90 and a future cash flow value estimate of $35.69, it appears undervalued, which sends a very different message about risk and potential reward.
That kind of gap between a rich sales multiple and a discounted cash flow upside can reflect very different assumptions about profitability and cash generation. The key question is which lens you trust more when weighing your next move as a shareholder or prospective investor.
Simply Wall St performs a discounted cash flow (DCF) on every stock in the world every day (check out Manchester United for example). We show the entire calculation in full. You can track the result in your watchlist or portfolio and be alerted when this changes, or use our stock screener to discover 44 high quality undervalued stocks. If you save a screener we even alert you when new companies match - so you never miss a potential opportunity.
Next Steps
With mixed signals around governance, valuation and future expectations for Manchester United, it makes sense to move quickly and test the numbers against your own thesis. A good starting point is the 3 key rewards and 1 important warning sign.
Looking for more investment ideas beyond Manchester United?
Once you have formed a view on Manchester United, do not stop there. Broader opportunity often sits in corners of the market you have not checked yet.
- Target steady compounders by reviewing companies with solid balance sheet and fundamentals stocks screener (48 results) and see which businesses pair resilient finances with meaningful earnings power.
- Hunt for mispriced opportunities using the 44 high quality undervalued stocks and compare potential upside against the risks you are willing to take.
- Prioritize resilience and focus on 66 resilient stocks with low risk scores that still offer room for long term compounding.
This article by Simply Wall St is general in nature. We provide commentary based on historical data and analyst forecasts only using an unbiased methodology and our articles are not intended to be financial advice. It does not constitute a recommendation to buy or sell any stock, and does not take account of your objectives, or your financial situation. We aim to bring you long-term focused analysis driven by fundamental data. Note that our analysis may not factor in the latest price-sensitive company announcements or qualitative material. Simply Wall St has no position in any stocks mentioned.