Manchester United (MANU) Valuation Check As Recent Trading Sends Mixed Signals
Manchester United Plc Class A MANU | 17.91 | +1.53% |
Context for recent Manchester United trading
Manchester United (NYSE:MANU) shares have moved without a specific headline catalyst, leaving investors to focus on the club’s fundamentals, recent share performance and how the business model as a global sports brand is currently being valued.
Recent trading has been mixed, with a 7 day share price return of 3.19% contrasting with a 30 day share price return of 6.63% and a year to date share price return of 4.50%. The 1 year total shareholder return stands at 18.98%, compared with weaker 3 and 5 year total shareholder returns. This suggests that short term momentum has picked up even as longer term holders have seen more modest outcomes.
If this kind of shift in momentum has your attention, it can be a good moment to broaden your search and check out 20 top founder-led companies
So with Manchester United trading at a discount to its analyst price target and an indicated intrinsic discount while still reporting a net loss, are you looking at an undervalued global sports brand or a stock where markets already price in future growth?
Preferred Price-to-Sales of 3.2x: Is it justified?
Manchester United last closed at $16.49, and on that price the shares trade on a P/S of 3.2x, which screens as expensive versus both the US Entertainment industry average of 1.4x and a peer average of 2.0x.
The P/S multiple compares the company’s market value to its revenue, so it is a simple way of seeing how much investors are currently willing to pay for each dollar of sales. For a global sports and media brand that generates income from matchday operations, sponsorships, media rights and merchandising, this kind of sales based yardstick is often used when earnings are still in loss making territory.
Here, the 3.2x P/S is more than double the wider US Entertainment group and also sits well above an estimated fair P/S ratio of 2.2x that is based on a broader regression style assessment. That gap signals the market is attaching a premium to Manchester United’s revenue base, even though the company reports a net loss of $9.06m on revenue of $655.40m and has less than one year of cash runway, which may limit financial flexibility if conditions change.
Against the industry, the premium is even starker. Investors are currently paying roughly 3.2x sales compared with 1.4x in the sector and 2.0x across a defined peer group. If the P/S multiple were to move closer to the 2.2x fair ratio level over time, that would imply a very different pricing of the same revenue stream than the market is assigning today.
Result: Price-to-Sales of 3.2x (OVERVALUED)
However, you still need to weigh the net loss of $9.06m and the company’s cash runway of less than one year, which could pressure the current revenue premium.
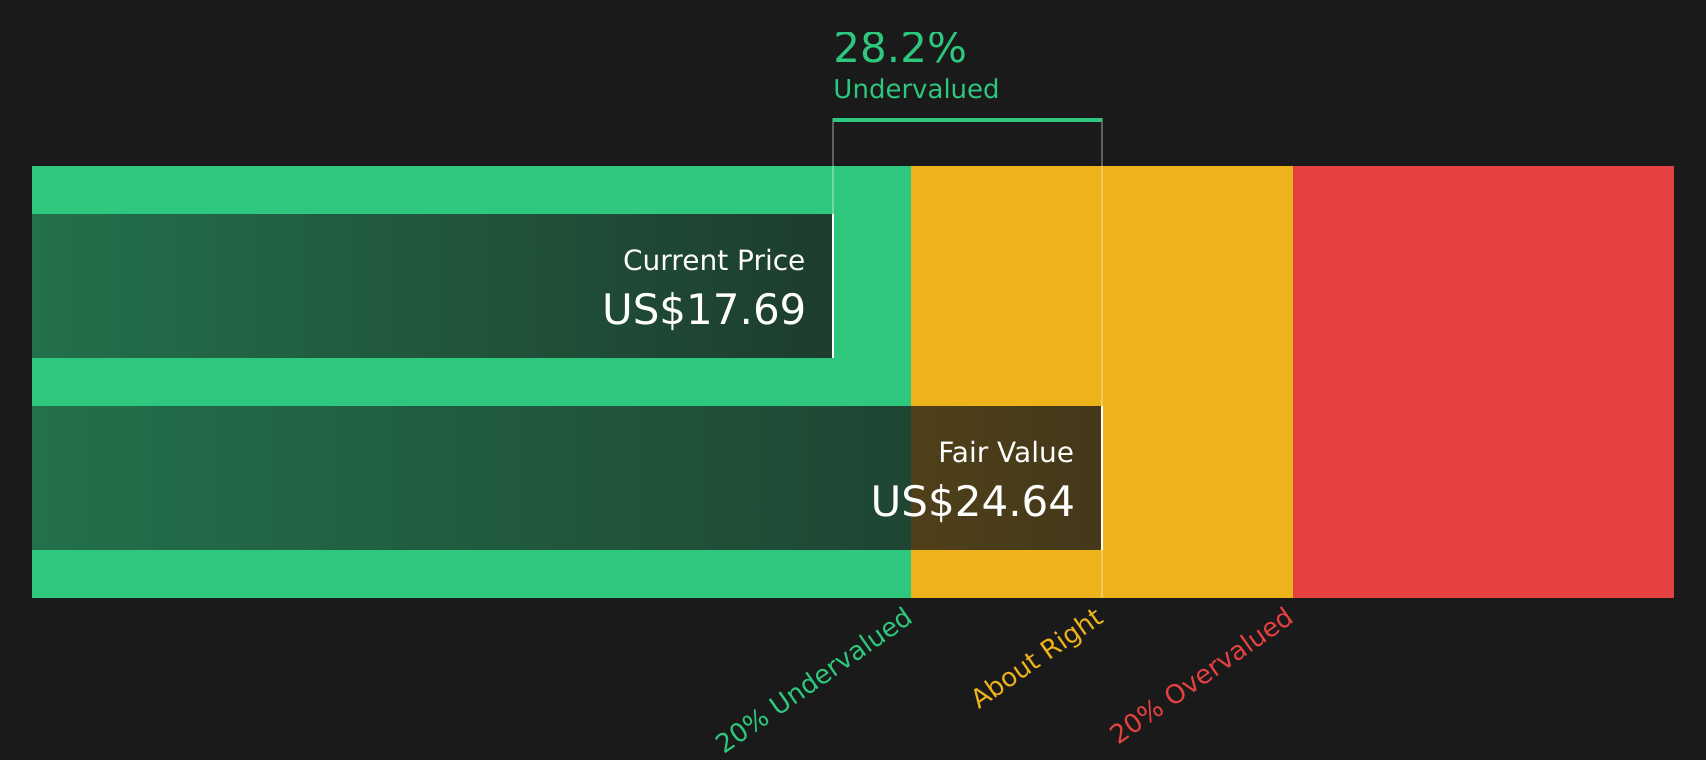
Another view on value: DCF points the other way
While the current 3.2x P/S ratio screens as expensive, the SWS DCF model paints a different picture. At $16.49, Manchester United is trading around 29.8% below an estimated fair value of $23.47, suggesting the cash flow outlook and the sales based yardstick are telling very different stories.
Simply Wall St performs a discounted cash flow (DCF) on every stock in the world every day (check out Manchester United for example). We show the entire calculation in full. You can track the result in your watchlist or portfolio and be alerted when this changes, or use our stock screener to discover 49 high quality undervalued stocks. If you save a screener we even alert you when new companies match - so you never miss a potential opportunity.
Next Steps
With mixed signals on value and sentiment, it can help to look past the headlines, review the key figures yourself and move quickly to shape your own view by weighing up the 3 key rewards and 1 important warning sign.
Looking for more investment ideas?
If you are serious about building a stronger portfolio, do not stop at one club stock when there are curated lists of opportunities ready for you to review.
- Target potential mispricing by reviewing companies on the 49 high quality undervalued stocks that combine quality fundamentals with more modest current expectations.
- Strengthen your income stream by scanning for reliable payers in the 13 dividend fortresses with yields that stand out and fundamentals you can inspect in detail.
- Protect your downside by focusing on companies featured in the 72 resilient stocks with low risk scores where balance sheets and risk scores are designed to give you more confidence.
This article by Simply Wall St is general in nature. We provide commentary based on historical data and analyst forecasts only using an unbiased methodology and our articles are not intended to be financial advice. It does not constitute a recommendation to buy or sell any stock, and does not take account of your objectives, or your financial situation. We aim to bring you long-term focused analysis driven by fundamental data. Note that our analysis may not factor in the latest price-sensitive company announcements or qualitative material. Simply Wall St has no position in any stocks mentioned.