Marsh & McLennan Companies (MRSH) Stock Could Be 41% Below Fair Value After New $4.25b Credit Deal
Marsh & McLennan Companies, Inc. MRSH | 0.00 |
Marsh & McLennan Companies (MRSH) recently entered a new US$4.25b multi currency unsecured five year revolving credit facility, replacing its prior US$3.5b line and extending maturity to June 2031.
Against this backdrop, Marsh & McLennan Companies’ 1 month share price return of 3.19% contrasts with a year to date share price decline of 8.92% and a 1 year total shareholder return decline of 21.81%, pointing to some recent, but still fragile, momentum.
If this financing move has you thinking about where else capital might flow next, it could be a good moment to scan for infrastructure related opportunities across 35 power grid technology and infrastructure stocks
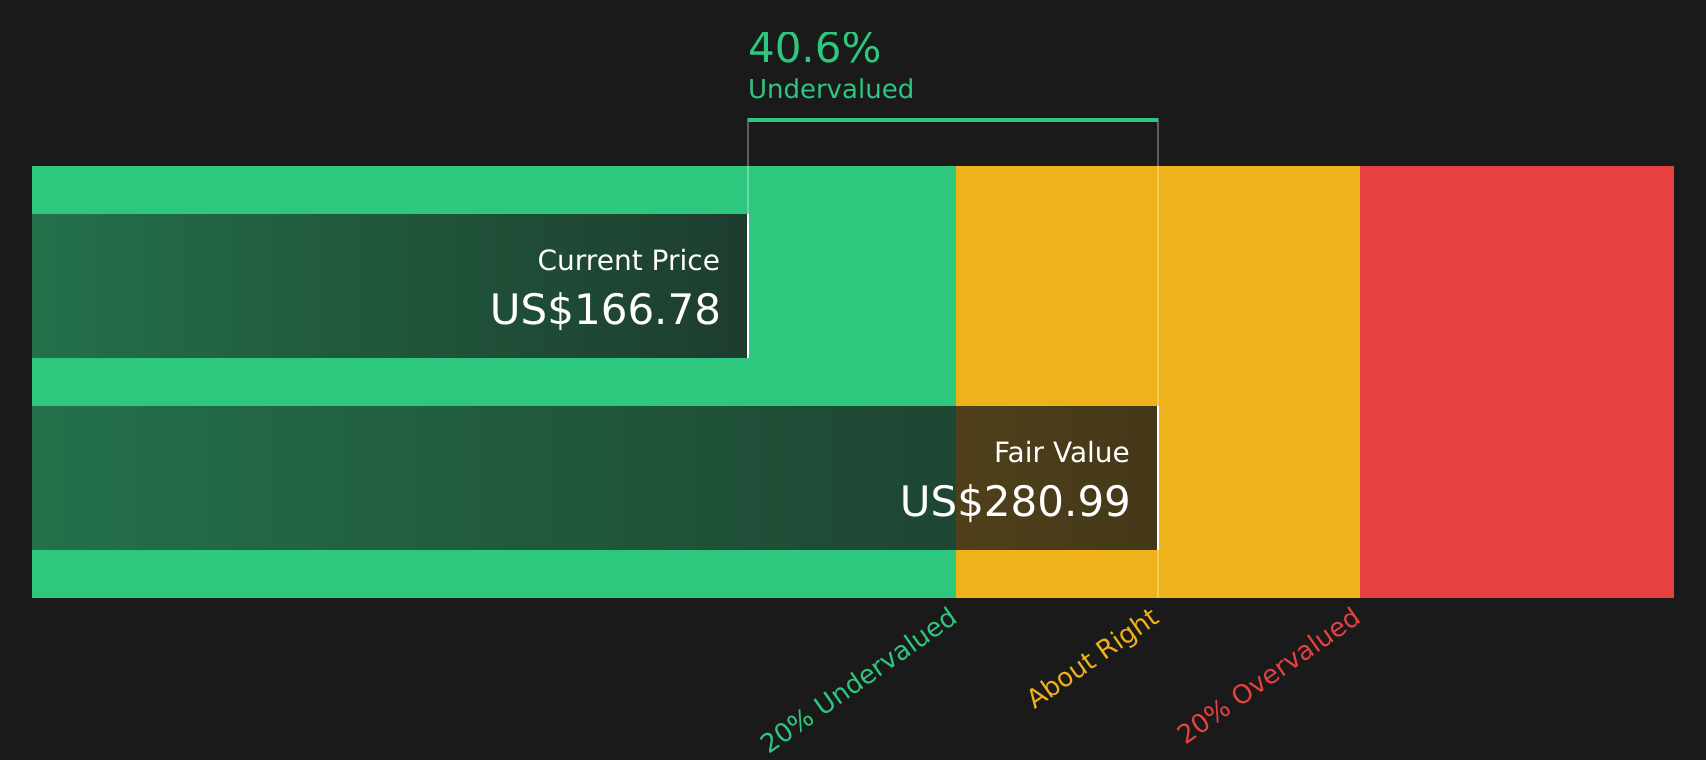
With Marsh & McLennan Companies stock down over the past year yet trading at a reported 41% discount to one intrinsic value estimate, the key question is whether this signals an undervalued opportunity or a market that is already pricing in future growth.
Price-to-Earnings of 20.5x: Is it justified?
Based on the preferred P/E multiple, Marsh & McLennan Companies stock looks expensive at a P/E of 20.5x, even with the last close at $166.19 and a reported 40.9% discount to one intrinsic value estimate.
The P/E ratio compares the share price to earnings per share, so a higher P/E usually means investors are paying more today for each dollar of current earnings. For a company like Marsh & McLennan Companies, which operates in insurance broking and consulting, P/E is often used as a quick shorthand for how much the market is willing to pay for its earnings profile.
Here, the company is described as expensive relative to an estimated fair P/E of 12.5x. This is a level the market could move toward if sentiment or expectations shift. At the same time, the current 20.5x multiple is framed as good value versus a peer average of 21.1x, so the stock sits at a slight discount to similar companies while still carrying a premium versus the broader US Insurance industry average P/E of 11.3x.
Result: Price-to-Earnings of 20.5x (OVERVALUED)
However, Marsh & McLennan Companies’ recent share price declines and a value score of 4 suggest sentiment could weaken further if earnings or growth expectations fall short.
Another View: SWS DCF Model Sees More Upside
While the P/E of 20.5x makes Marsh & McLennan Companies stock look expensive against an estimated fair ratio of 12.5x, the SWS DCF model points the other way, with an intrinsic value of $280.99 versus the current $166.19, implying the shares are trading at a sizeable discount. Which lens should carry more weight for you right now?
Simply Wall St performs a discounted cash flow (DCF) on every stock in the world every day (check out Marsh & McLennan Companies for example). We show the entire calculation in full. You can track the result in your watchlist or portfolio and be alerted when this changes, or use our stock screener to discover 47 high quality undervalued stocks. If you save a screener we even alert you when new companies match - so you never miss a potential opportunity.
Next Steps
If this mix of risks and rewards around Marsh & McLennan Companies feels finely balanced, use the full data set to shape your stance quickly. You can start with the 4 key rewards and 1 important warning sign
Looking for more investment ideas beyond Marsh & McLennan Companies?
If you want to stress test your view on Marsh & McLennan Companies, compare it with other stocks that match different quality, value, and income profiles using the Simply Wall St Screener.
- Target potential mispricings by scanning a curated set of screener containing 20 high quality undiscovered gems that combine solid fundamentals with lower market attention.
- Strengthen your focus on capital preservation by reviewing 68 resilient stocks with low risk scores that score well on resilience and downside control.
- Build a core watchlist of quality companies using the solid balance sheet and fundamentals stocks screener (48 results) to spot businesses backed by stronger financial foundations.
This article by Simply Wall St is general in nature. We provide commentary based on historical data and analyst forecasts only using an unbiased methodology and our articles are not intended to be financial advice. It does not constitute a recommendation to buy or sell any stock, and does not take account of your objectives, or your financial situation. We aim to bring you long-term focused analysis driven by fundamental data. Note that our analysis may not factor in the latest price-sensitive company announcements or qualitative material. Simply Wall St has no position in any stocks mentioned.