Marsh & McLennan (MRSH) Valuation Check After Strong Earnings AI Push And Capital Returns
Marsh & McLennan Companies, Inc. MRSH | 174.61 | +1.59% |
Marsh & McLennan Companies (MRSH) is back in focus after reporting fourth quarter and full year 2025 earnings alongside an updated capital allocation plan, highlighting a combination of revenue growth, growing net income and ongoing buybacks.
At a share price of US$188.25, Marsh & McLennan has seen a 7 day share price return of 2.5% and a 90 day share price return of 4.29%, while the 1 year total shareholder return of 12.67% decline contrasts with a 5 year total shareholder return of 78.13%. This suggests shorter term momentum has softened compared to the longer term, even as recent earnings, buybacks and new products like Secure Harbor keep the story in focus.
If this kind of steady compounder appeals to you, it could be worth scanning stable growth stocks screener (None results) for other businesses with more consistent track records. It is an easy way to widen your watchlist with similar profiles.
With shares trading at US$188.25 and management talking up AI, digital infrastructure and capital returns, should you view MRSH’s current valuation and intrinsic discount as an opportunity to invest, or is the market already factoring in potential growth?
Most Popular Narrative: 9.1% Undervalued
With Marsh & McLennan Companies trading at $188.25 versus a narrative fair value of $207, the widely followed view frames the shares as modestly undervalued on a discounted cash flow basis using a 6.96% discount rate.
Strategic investments in digital transformation, advanced analytics, and AI (for example, proprietary data tools for risk modeling and agentic interfaces) are expected to enhance operational efficiency and improve product and service offerings, enabling margin expansion and net earnings growth through improved client retention and lower cost to serve.
Curious what sits behind that fair value gap? The narrative leans heavily on steady revenue compounding, firmer margins, and a richer future earnings multiple than many insurers enjoy. The full set of assumptions is where the story really gets interesting.
Result: Fair Value of $207 (UNDERVALUED)
However, softer P&C pricing and pressure on liability insurance costs could still cap revenue growth and margins and may challenge the idea that MRSH is comfortably undervalued.
Another Angle On Valuation
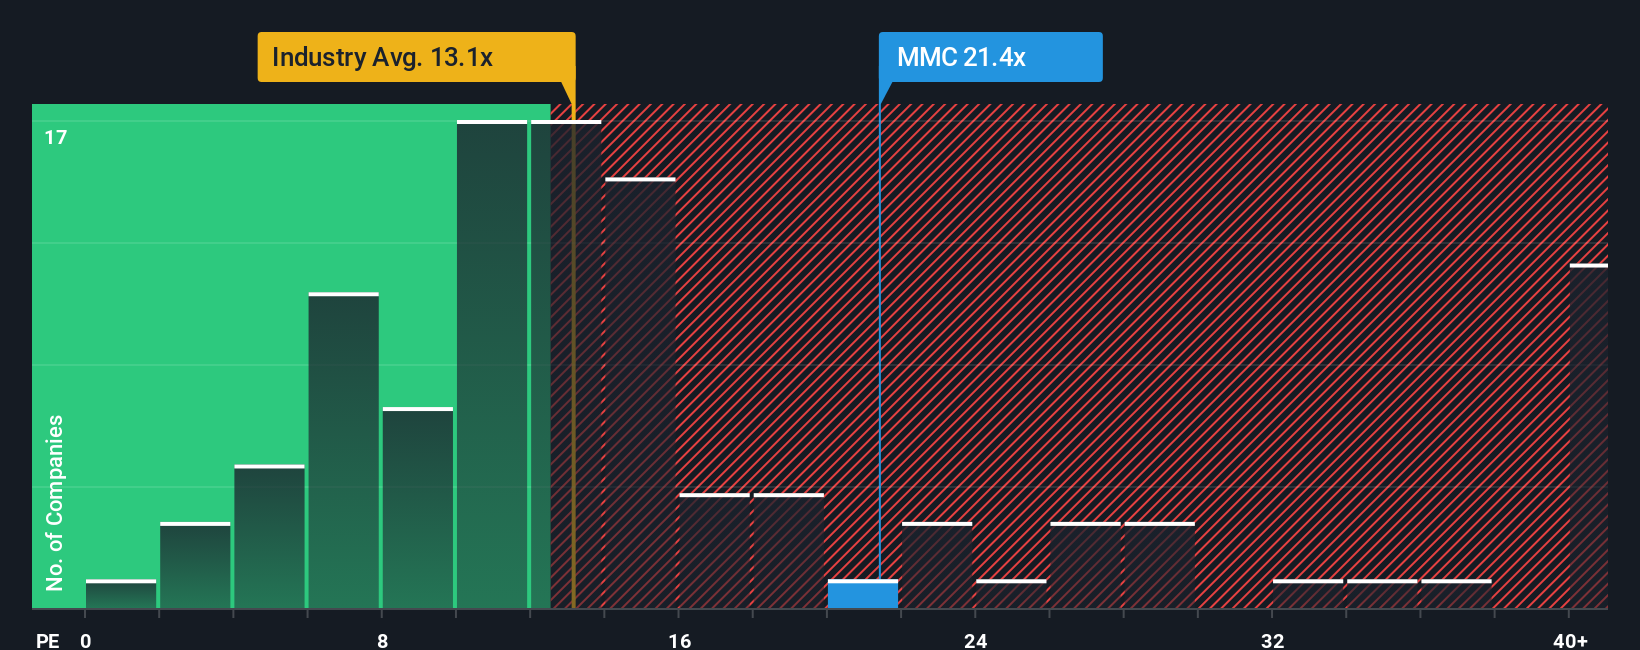
That 9.1% DCF based undervaluation is only one side of the story. On earnings, MRSH trades on a P/E of 21.9x, which is higher than the US Insurance industry at 13.2x and also above its own fair ratio of 15.4x, even though it sits below peer average at 24.9x.
In plain terms, the stock carries a richer earnings tag than the sector and what our fair ratio suggests the market could lean toward over time, yet looks cheaper than close peers. For you, that raises a simple question: is this a quality premium worth paying or a valuation risk waiting to compress?
Build Your Own Marsh & McLennan Companies Narrative
If you look at the numbers and come to a different conclusion, or simply prefer to test your own assumptions, you can build a custom MRSH story in just a few minutes with Do it your way.
A great starting point for your Marsh & McLennan Companies research is our analysis highlighting 4 key rewards and 1 important warning sign that could impact your investment decision.
Looking For More Investment Ideas?
If MRSH is on your radar, do not stop there. Use the Simply Wall St Screener to quickly surface fresh ideas that fit your style and preferences.
- Target potential high growth stories early by scanning these 3535 penny stocks with strong financials that already show stronger financial foundations than many tiny names in the market.
- Position yourself in powerful themes by checking out these 24 AI penny stocks that are linked to artificial intelligence trends investors are watching closely.
- Focus your time on pricing opportunities by reviewing these 874 undervalued stocks based on cash flows that screen as cheap based on cash flows, instead of trawling through hundreds of stocks manually.
This article by Simply Wall St is general in nature. We provide commentary based on historical data and analyst forecasts only using an unbiased methodology and our articles are not intended to be financial advice. It does not constitute a recommendation to buy or sell any stock, and does not take account of your objectives, or your financial situation. We aim to bring you long-term focused analysis driven by fundamental data. Note that our analysis may not factor in the latest price-sensitive company announcements or qualitative material. Simply Wall St has no position in any stocks mentioned.