Morningstar (MORN) Valuation Check After Launch Of PitchBook GenAI 20 Index
Morningstar, Inc. MORN | 172.91 | +2.19% |
Morningstar (MORN) recently launched the Morningstar PitchBook GenAI 20 Index, a new benchmark that tracks pure-play generative AI companies across their journey from private ownership to public markets.
Despite launching the PitchBook GenAI 20 Index and publishing fresh retirement research, Morningstar’s recent share price return has been weak, with a 30-day share price return decline of 7.69% and a 1-year total shareholder return loss of 38.67%, suggesting sentiment has cooled after earlier enthusiasm.
If this kind of AI themed index launch has caught your attention, it could be a good time to widen your research and scan high growth tech and AI stocks for other potential ideas.
With Morningstar shares falling over the past year while revenue and net income still sit in the billions, investors now face a key question: is this weakness creating a potential entry point, or is the market already pricing in future growth?
Preferred P/E of 22.4x: Is it justified?
Morningstar currently trades on a P/E of 22.4x, which sits below both peer and broader Capital Markets averages, even after a weak recent share price performance.
The P/E ratio compares the share price with earnings per share, so it reflects what investors are paying today for each dollar of current earnings.
For Morningstar, a 22.4x P/E sits against a mixed backdrop. On one side, earnings have grown 15.7% per year over the past 5 years, net income is $376.0m on revenue of $2.4b, and return on equity is a high 24.8%. On the other side, earnings and revenue are forecast to grow slower than the wider US market and the SWS DCF model currently estimates a future cash flow value below the recent share price.
Compared with peers, Morningstar’s 22.4x P/E is framed as good value versus the peer average of 27.2x and the US Capital Markets industry average of 24.1x, so the stock trades at a discount to those groups. However, against an estimated fair P/E of 14.7x, the current multiple screens as expensive, suggesting room for the market to adjust closer to that fair ratio if expectations moderate.
Result: Price-to-Earnings of 22.4x (OVERVALUED)
However, there are clear risks, including Morningstar’s 38.67% 1 year total return loss, as well as any setback across its data, analytics or PitchBook driven growth engines.
Another View: DCF Points to a Different Story
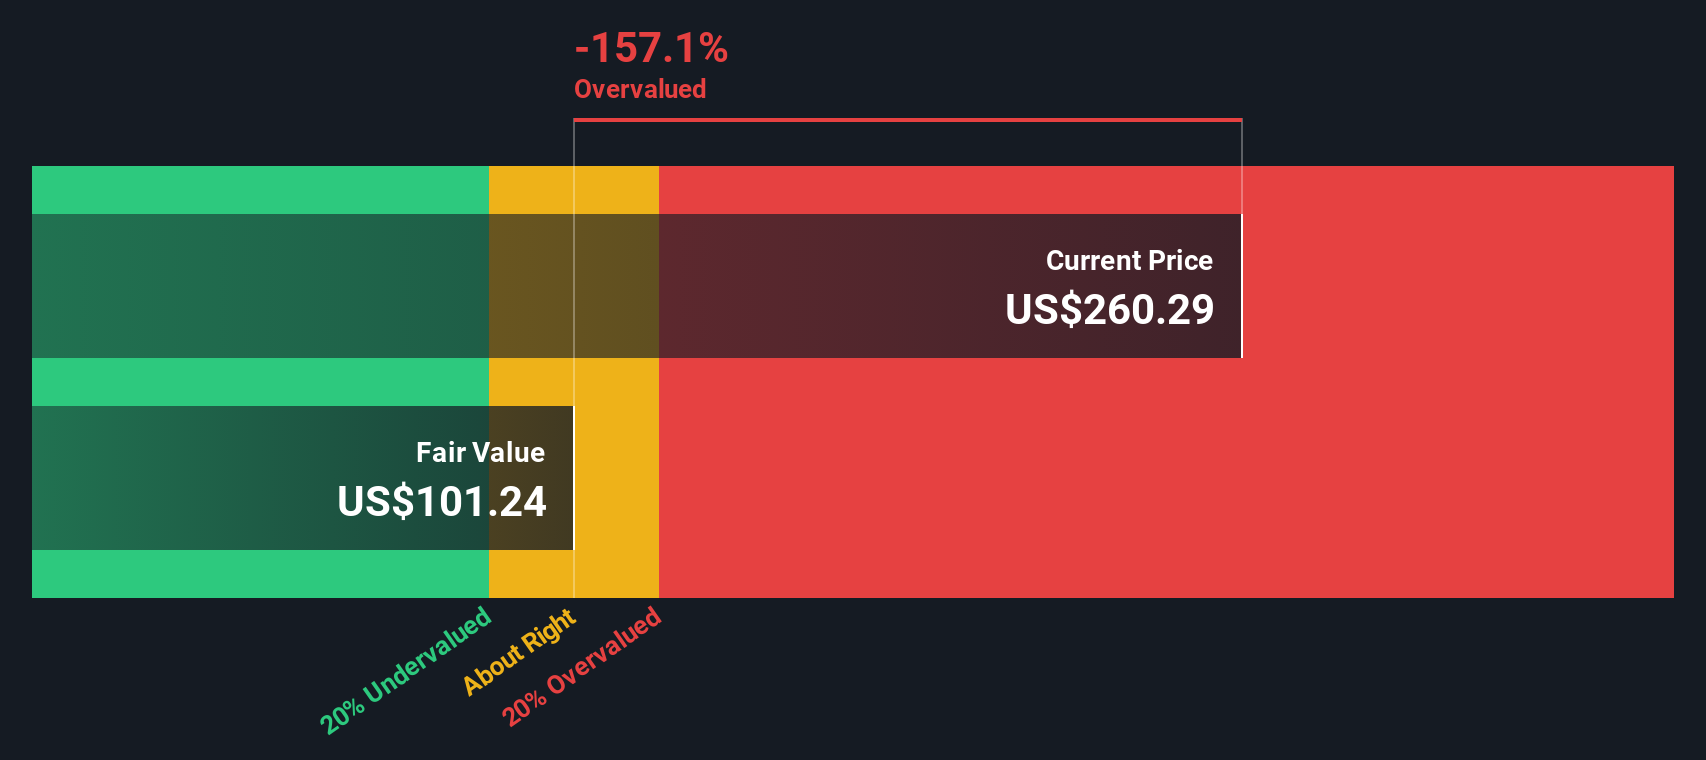
While the 22.4x P/E suggests Morningstar is cheaper than peers, our DCF model tells a different story. With the share price at about $204.60 and our future cash flow value at $100.72, the model flags the stock as overvalued. This raises the question of which signal you trust more.
Simply Wall St performs a discounted cash flow (DCF) on every stock in the world every day (check out Morningstar for example). We show the entire calculation in full. You can track the result in your watchlist or portfolio and be alerted when this changes, or use our stock screener to discover 869 undervalued stocks based on their cash flows. If you save a screener we even alert you when new companies match - so you never miss a potential opportunity.
Build Your Own Morningstar Narrative
If you see the numbers differently or prefer to piece together your own view, you can build a personalized story in just a few minutes by starting with Do it your way.
A good starting point is our analysis highlighting 4 key rewards investors are optimistic about regarding Morningstar.
Looking for more investment ideas?
If Morningstar has you thinking harder about valuation and growth, do not stop here. Broaden your watchlist now so you are not playing catch up later.
- Spot potential value gaps by checking out these 869 undervalued stocks based on cash flows that may offer prices below their underlying cash flow estimates.
- Tap into the excitement around artificial intelligence through these 23 AI penny stocks focused on companies tied to this technology theme.
- Get ahead of emerging digital trends by reviewing these 19 cryptocurrency and blockchain stocks connected to cryptocurrency and blockchain activity.
This article by Simply Wall St is general in nature. We provide commentary based on historical data and analyst forecasts only using an unbiased methodology and our articles are not intended to be financial advice. It does not constitute a recommendation to buy or sell any stock, and does not take account of your objectives, or your financial situation. We aim to bring you long-term focused analysis driven by fundamental data. Note that our analysis may not factor in the latest price-sensitive company announcements or qualitative material. Simply Wall St has no position in any stocks mentioned.