MSA Safety (MSA) Valuation Check After Q4 2025 Earnings Beat And Optimistic 2026 Outlook
MSA Safety, Inc. MSA | 165.89 165.89 | -3.31% 0.00% Pre |
MSA Safety (MSA) is back in focus after reporting Q4 and full year 2025 results that topped revenue and profit expectations, helped by strong detection segment performance and tight cost control.
The latest set of results appears to have kept momentum intact, with the 30 day share price return of 12.11% and 90 day gain of 29.21% lifting the stock to US$201.94. Over the past year, total shareholder return of 29.20% and a 3 year total shareholder return of 49.25% point to a story where recent enthusiasm is building on a longer period of positive compounding.
If MSA Safety’s recent move has you thinking about other potential opportunities tied to industrial and infrastructure trends, it could be worth checking our screener of 25 power grid technology and infrastructure stocks as a starting list for further ideas.
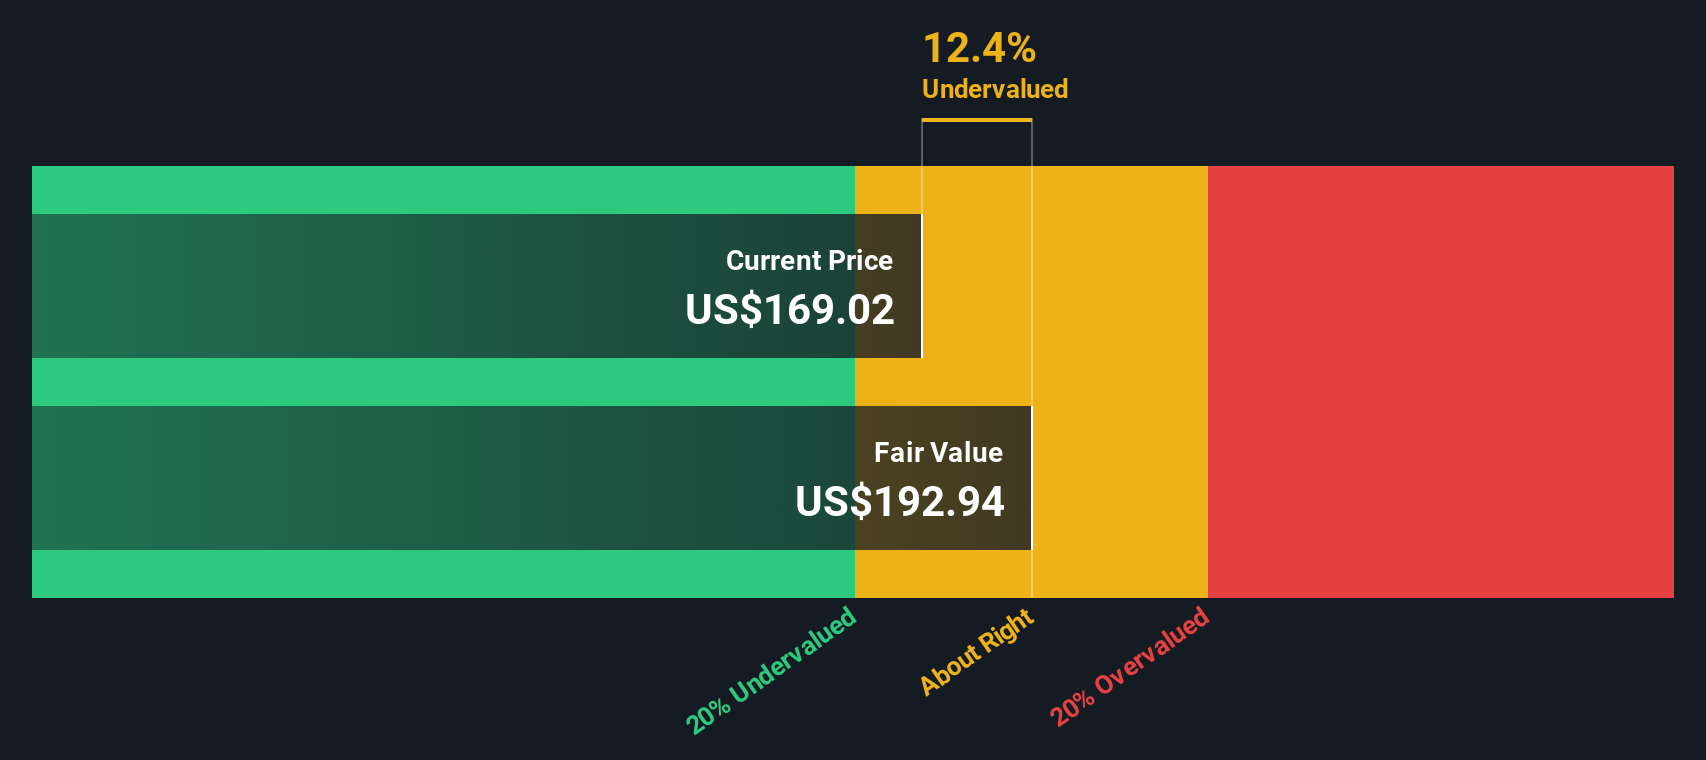
With MSA now trading just above the average analyst price target but about 31% below one estimate of intrinsic value, the key question is whether there is still a buying opportunity here or whether the current price already reflects expectations for future growth.
Most Popular Narrative: 1.9% Overvalued
Compared with the most followed narrative fair value of $198.14, MSA Safety’s last close at $201.94 sits slightly higher, leaving a modest value gap to unpack.
Strategic R&D investments and fast innovation cycles (with imminent new product launches like the io 6) are allowing MSA to continually upgrade its product portfolio, supporting sustained organic growth rates and higher EBITDA margins due to market leading offerings and product mix improvement.
Curious what earnings path, margin lift, and future P/E this narrative threads together to land at that fair value? The underlying model leans on measured growth, richer profitability and a valuation multiple that edges below the broader sector. All of this is carefully discounted back using a single required return assumption. The full narrative lays out how those moving parts connect.
Result: Fair Value of $198.14 (OVERVALUED)
However, you still need to watch for risks such as ongoing margin pressure from tariffs and foreign exchange, as well as softer demand in core Fire Service and PPE lines.
Another View: Cash Flows Point a Different Way
While the most popular narrative sees MSA Safety as about 1.9% overvalued at $201.94 versus a fair value of $198.14, our DCF model points in almost the opposite direction. On that framework, the shares trade roughly 31% below an estimated value of $294.53. This raises a simple question: which set of assumptions do you trust more?
Simply Wall St performs a discounted cash flow (DCF) on every stock in the world every day (check out MSA Safety for example). We show the entire calculation in full. You can track the result in your watchlist or portfolio and be alerted when this changes, or use our stock screener to discover 53 high quality undervalued stocks. If you save a screener we even alert you when new companies match - so you never miss a potential opportunity.
Build Your Own MSA Safety Narrative
If you see the numbers differently or prefer to work from your own assumptions, you can pull together a custom narrative in just a few minutes: Do it your way.
A good starting point is our analysis highlighting 2 key rewards investors are optimistic about regarding MSA Safety.
Looking for more investment ideas?
If MSA has sparked your interest, do not stop at one company, use the Simply Wall Street Screener to surface a broader set of opportunities tailored to your style.
- Target quality at a discount by reviewing our list of 53 high quality undervalued stocks that pair strong fundamentals with prices that may not fully reflect them.
- Prioritise resilience by scanning 85 resilient stocks with low risk scores designed to highlight businesses with lower overall risk scores.
- Get early to potential standouts through a screener containing 23 high quality undiscovered gems that focuses on fundamentally strong companies that may not be widely followed yet.
This article by Simply Wall St is general in nature. We provide commentary based on historical data and analyst forecasts only using an unbiased methodology and our articles are not intended to be financial advice. It does not constitute a recommendation to buy or sell any stock, and does not take account of your objectives, or your financial situation. We aim to bring you long-term focused analysis driven by fundamental data. Note that our analysis may not factor in the latest price-sensitive company announcements or qualitative material. Simply Wall St has no position in any stocks mentioned.