MSCI (MSCI) Valuation Check As Earnings Growth Meets Softer Q4 And Higher Buybacks And Dividend
MSCI Inc. Class A MSCI | 544.78 | +1.47% |
Why MSCI’s latest earnings, buybacks and dividend move matter
MSCI (MSCI) is back in the spotlight after its fourth quarter and full year 2025 results, updated share repurchase activity, and a higher cash dividend, all of which directly affect shareholder returns.
For the fourth quarter, MSCI reported sales of US$822.53 million, compared with US$743.51 million a year earlier. Net income was US$284.67 million versus US$305.52 million, with diluted earnings per share from continuing operations of US$3.81 compared with US$3.90.
Across the full year, sales came in at US$3.13b compared with US$2.86b a year earlier, while net income was US$1.20b versus US$1.11b. Diluted earnings per share from continuing operations was US$15.69 compared with US$14.05.
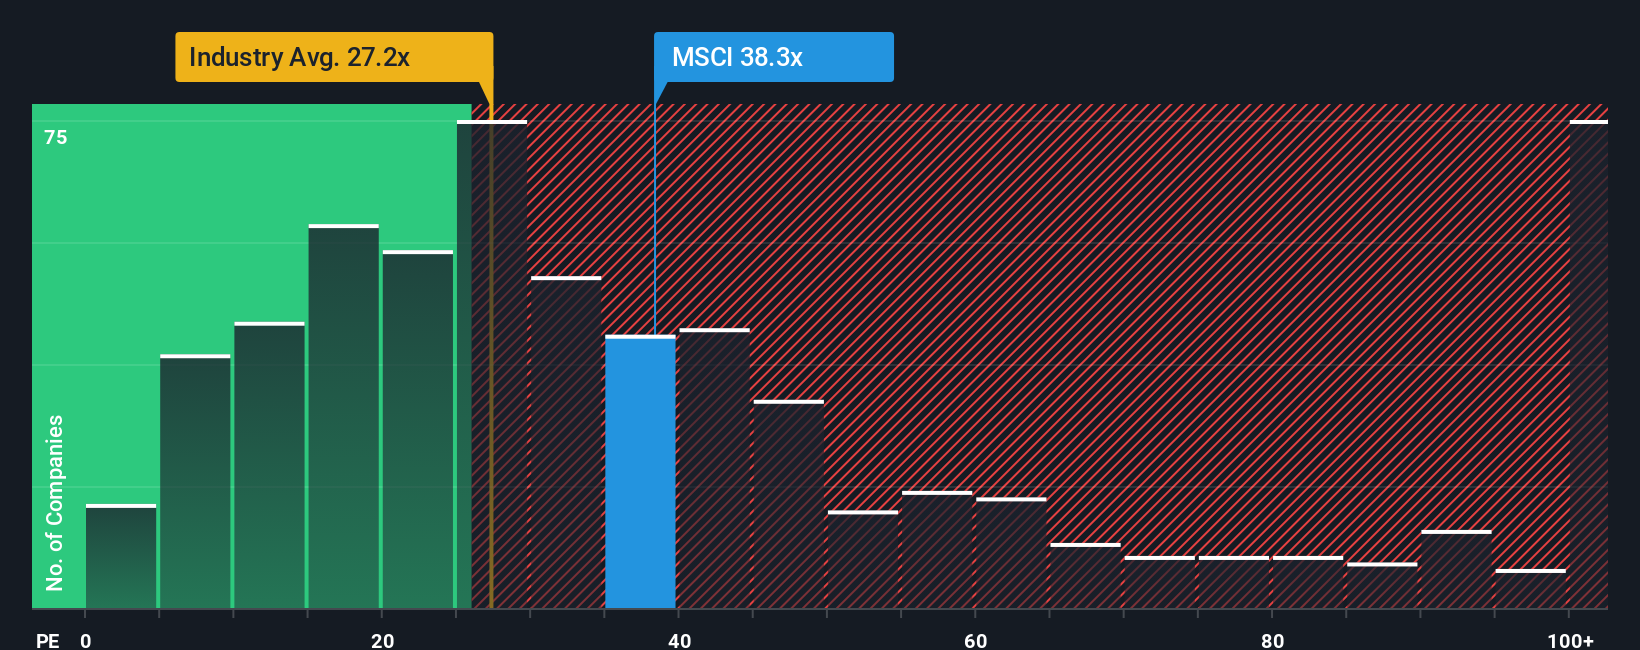
At a recent share price of US$557.78 and a forward P/E of about 30x, investors are paying a premium multiple for MSCI’s index, analytics, ESG, climate and private assets tools that many institutions rely on for portfolio decision support.
Despite the higher dividend and recent completion of sizeable buybacks, MSCI’s short term momentum has softened, with a 7 day share price return of 8.44% and a year to date share price return of 1.32%, while its 5 year total shareholder return of 35.04% reflects a very different experience for longer term holders.
If this news has you thinking about where else to put capital to work in listed market infrastructure and data providers, it could be worth broadening your search with 22 top founder-led companies
With the stock trading on about 30x forward P/E and sitting below analyst targets, the key question is whether the recent pullback and richer shareholder payouts hint at value or if the market is already baking in future growth.
Most Popular Narrative: 17.8% Undervalued
Against the last close of $557.78, the most followed narrative pegs MSCI’s fair value at $678.20, implying a sizeable valuation gap built on specific growth and margin expectations.
Accelerated development and cross-selling of proprietary data, analytics, and private capital solutions (including recently launched products and business lines like private equity benchmarks and risk tools) will tap into new client bases and increase wallet share among institutional clients, driving durable multi-year compounded revenue growth.
Want to see what is behind that optimism? The narrative leans on steady top line expansion, higher margins, and a future earnings multiple that assumes MSCI keeps earning its premium reputation.
Result: Fair Value of $678.20 (UNDERVALUED)
However, there are clear pressure points, including fee compression on asset based revenues and softer retention in analytics or ESG, which could quickly challenge today’s premium narrative.
Another View: Paying Up For Quality?
That 17.8% implied upside sits uncomfortably next to MSCI’s current P/E of 34.1x, which is higher than the US Capital Markets industry at 23.3x, the peer average at 25.8x, and our fair ratio of 17.3x. If the market drifts toward that fair ratio instead, how much valuation risk are you really comfortable with?
Build Your Own MSCI Narrative
If you see the numbers differently or prefer testing your own assumptions, you can build a custom MSCI view in a few minutes: Do it your way
A great starting point for your MSCI research is our analysis highlighting 5 key rewards and 1 important warning sign that could impact your investment decision.
Ready for more investment ideas?
If MSCI has sharpened your thinking, do not stop here. The real edge often comes from lining it up against other high quality ideas on your radar.
- Spot potential value plays early by checking companies our screener flags as 52 high quality undervalued stocks before they hit everyone else's watchlist.
- Strengthen your defensives by focusing on businesses highlighted in our solid balance sheet and fundamentals stocks screener (45 results) that prioritise robust finances.
- Get ahead of the crowd by scanning our screener containing 24 high quality undiscovered gems and see which names might still be flying under most investors' radars.
This article by Simply Wall St is general in nature. We provide commentary based on historical data and analyst forecasts only using an unbiased methodology and our articles are not intended to be financial advice. It does not constitute a recommendation to buy or sell any stock, and does not take account of your objectives, or your financial situation. We aim to bring you long-term focused analysis driven by fundamental data. Note that our analysis may not factor in the latest price-sensitive company announcements or qualitative material. Simply Wall St has no position in any stocks mentioned.