

Murphy USA (MUSA) Is Down 6.7% After EPS Jump and Major Buyback Completion - What's Changed
Murphy USA, Inc. MUSA | 0.00 |
- In the second quarter of 2026, Murphy USA Inc. reported revenue of US$6,806.1 million and net income of US$209.1 million, with basic earnings per share from continuing operations of US$11.34, all higher than the same period a year earlier.
- Over the six months to June 30, 2026, Murphy USA’s stronger earnings coincided with completing a large share repurchase program that retired 15.67% of its shares under a buyback launched in 2023, alongside no purchases yet under a newer 2025 authorization.
- We’ll now examine how Murphy USA’s sharp earnings per share growth and substantial completed buyback program shape its existing investment narrative.
AI is about to change healthcare. These 43 stocks are working on everything from early diagnostics to drug discovery. The best part - they are all under $10b in market cap - there's still time to get in early.
Murphy USA Investment Narrative Recap
To stay invested in Murphy USA, you need to believe its high-volume, low-cost fuel model and convenience footprint can keep generating solid cash flows despite fuel demand headwinds and EV risk. The latest results show stronger earnings and EPS, but they do not fundamentally change the near term tension between fuel volume softness and the need for merchandise growth, nor do they remove execution risk around new store openings.
The most relevant recent announcement here is the completion of the 2023 share repurchase program, which retired 15.67% of shares while EPS moved higher. That combination reinforces how much of Murphy USA’s recent per share earnings growth has come from buybacks alongside operating performance, and it matters for how you weigh future catalysts like store expansion and digital initiatives against balance sheet capacity and ongoing shareholder returns.
Yet behind these strong numbers, investors should also be aware of the longer term pressure from EV adoption and how it could eventually reshape...
Murphy USA's narrative projects $21.8 billion revenue and $550.4 million earnings by 2029. This requires 8.0% yearly revenue growth and a $3.3 million earnings decrease from $553.7 million today.
Uncover how Murphy USA's forecasts yield a $630.90 fair value, a 14% upside to its current price.
Exploring Other Perspectives
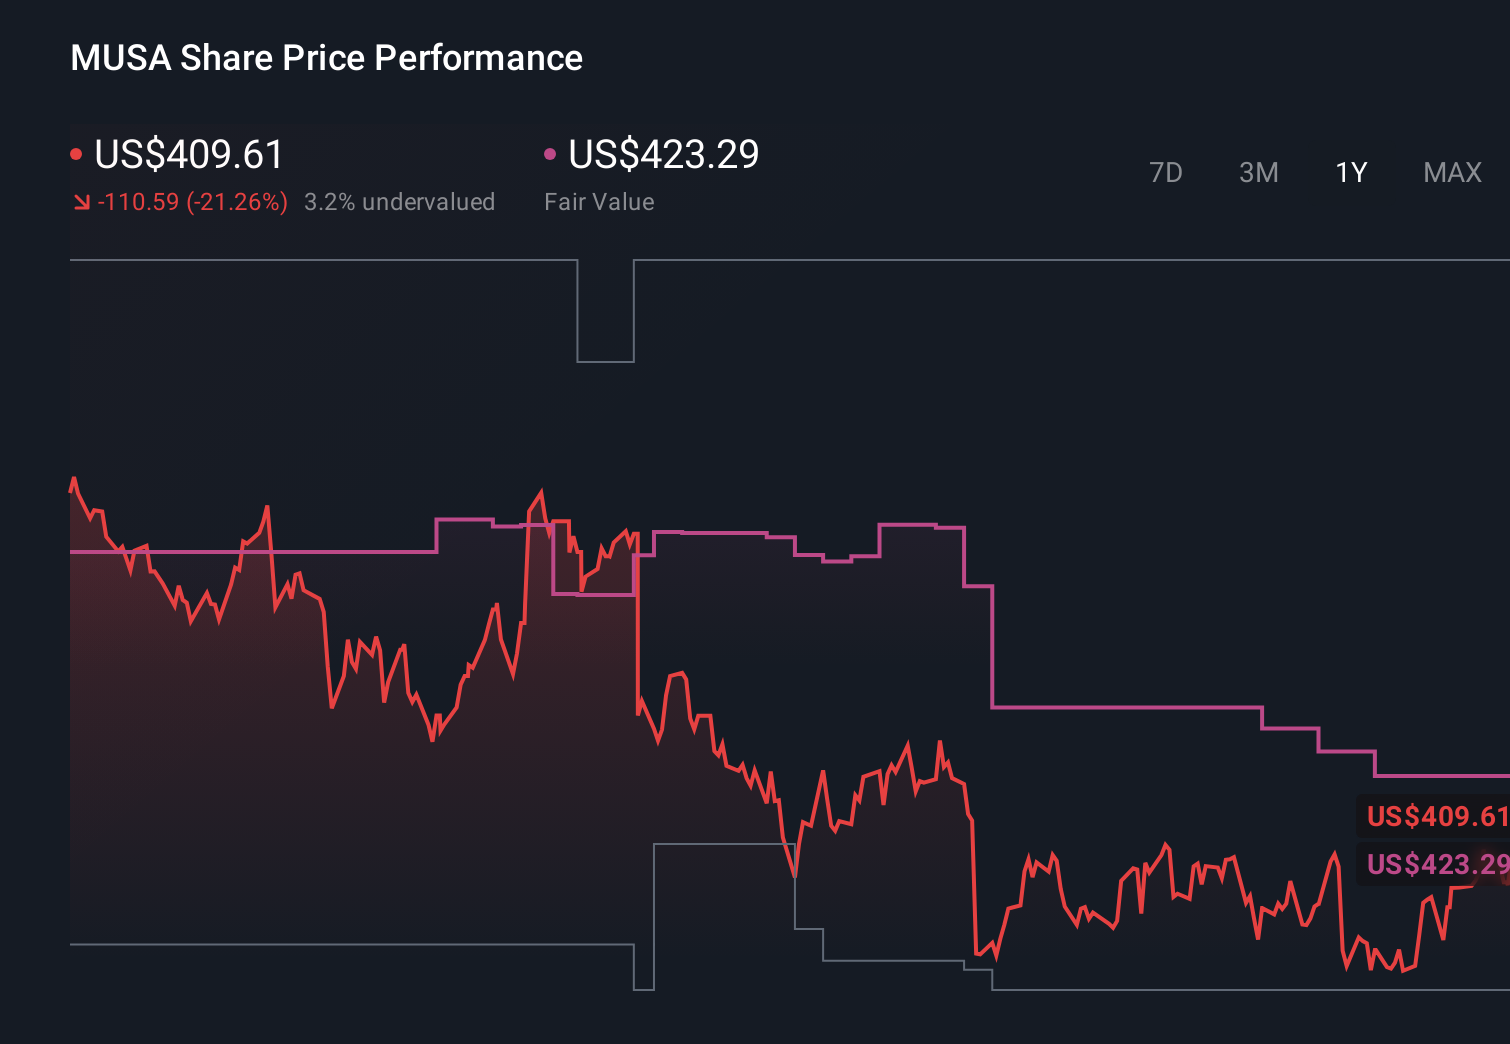
Some of the most optimistic analysts were already expecting about US$23.7 billion of revenue and US$575 million of earnings by 2029, and they see store expansion as a powerful offset to EV and merchandise mix risks, so this stronger quarter might either reinforce their view or prompt a rethink of just how much upside is really on the table.
Explore 3 other fair value estimates on Murphy USA - why the stock might be worth as much as 14% more than the current price!
Reach Your Own Conclusion
Disagree with existing narratives? Extraordinary investment returns rarely come from following the herd, so go with your instincts.
- A great starting point for your Murphy USA research is our analysis highlighting 2 key rewards and 3 important warning signs that could impact your investment decision.
- Our free Murphy USA research report provides a comprehensive fundamental analysis summarized in a single visual - the Snowflake - making it easy to evaluate Murphy USA's overall financial health at a glance.
Want Some Alternatives?
Early movers are already taking notice. See the stocks they're targeting before they've flown the coop:
- Capitalize on the AI infrastructure supercycle with our selection of the 56 best 'picks and shovels' of the AI gold rush converting record-breaking demand into massive cash flow.
- Invest in the nuclear renaissance through our list of 89 elite nuclear energy infrastructure plays powering the global AI revolution.
- The future of work is here. Discover the 37 top robotics and automation stocks leading the charge in AI-driven automation and industrial transformation.
This article by Simply Wall St is general in nature. We provide commentary based on historical data and analyst forecasts only using an unbiased methodology and our articles are not intended to be financial advice. It does not constitute a recommendation to buy or sell any stock, and does not take account of your objectives, or your financial situation. We aim to bring you long-term focused analysis driven by fundamental data. Note that our analysis may not factor in the latest price-sensitive company announcements or qualitative material. Simply Wall St has no position in any stocks mentioned.