Murphy USA (MUSA) Stock Price After 365% Run Is It Too Late To Invest
Murphy USA, Inc. MUSA | 0.00 |
- If you are wondering whether Murphy USA stock still offers value at current levels, a good starting point is understanding how its current price lines up with different valuation checks.
- Murphy USA last closed at US$586.83, with returns of 7.4% over the past week, 4.5% over the past month, 44.8% year to date, 51.9% over one year, 105.8% over three years, and 364.0% over five years.
- Recent coverage of Murphy USA has focused on how the stock's strong multi year performance has sharpened questions about whether the current price still reflects its fundamentals. Those discussions have put more attention on valuation tools such as discounted cash flow models, peer comparisons and asset based checks.
- On Simply Wall St's 6 point valuation framework, Murphy USA currently scores 1 out of 6. The next sections will walk through what different valuation approaches say about that score, then finish with a broader way to think about value that goes beyond the numbers alone.
Murphy USA scores just 1/6 on our valuation checks. See what other red flags we found in the full valuation breakdown.
Approach 1: Murphy USA Discounted Cash Flow (DCF) Analysis
A Discounted Cash Flow, or DCF, model estimates what a stock could be worth by projecting the company’s future cash flows and then discounting those back to today’s value. For Murphy USA, this uses a 2 stage Free Cash Flow to Equity model built on $ free cash flow forecasts.
Murphy USA currently has last twelve month free cash flow of about $601.3 million. Analysts have provided explicit forecasts out to 2029, with Simply Wall St extrapolating cash flows further. For example, projected free cash flow is $577.4 million in 2026 and $467.8 million in 2030, with intermediate years ranging between those levels according to the supplied estimates and extrapolations.
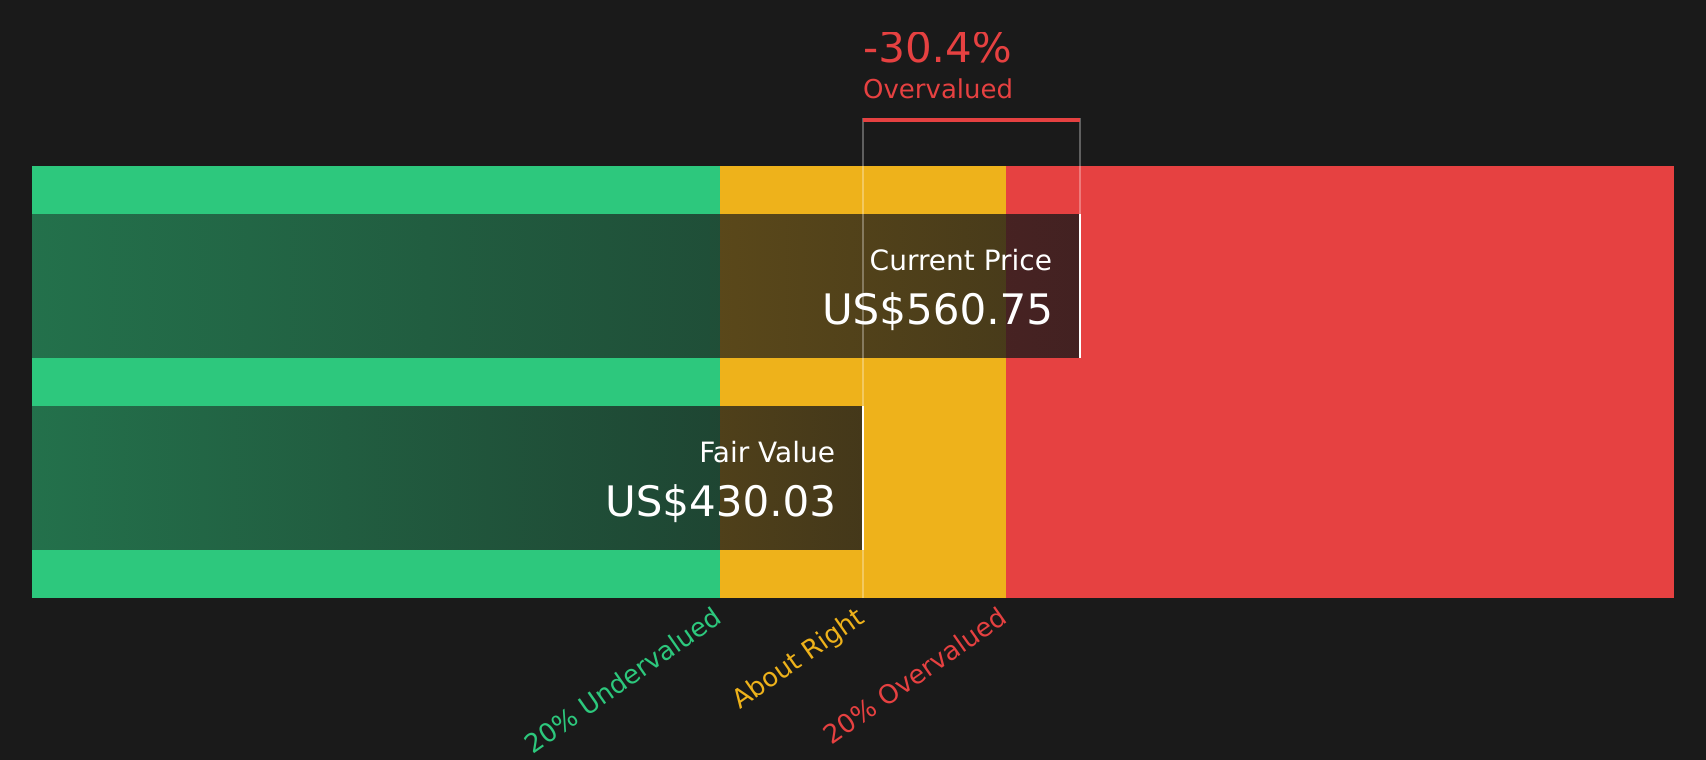
When these projected cash flows are discounted back and combined, the DCF model points to an estimated intrinsic value of about $435.76 per share. Compared with the recent share price of $586.83, the model implies Murphy USA stock is about 34.7% above this estimate. On this particular approach, it therefore screens as overvalued.
Result: OVERVALUED
Our Discounted Cash Flow (DCF) analysis suggests Murphy USA may be overvalued by 34.7%. Discover 47 high quality undervalued stocks or create your own screener to find better value opportunities.
Approach 2: Murphy USA Price vs Earnings
For a profitable company like Murphy USA, the P/E ratio is a useful shorthand for how much investors are paying for each dollar of current earnings. A higher or lower P/E often reflects what the market expects for future growth and how risky those earnings might be, so what counts as a “normal” or “fair” P/E depends on those factors rather than a single fixed number.
Murphy USA currently trades on a P/E of 19.6x. That is below the Specialty Retail industry average P/E of 20.5x, but above the peer group average of 15.6x. To give more context than simple comparisons, Simply Wall St also calculates a “Fair Ratio” for Murphy USA of 12.9x.
The Fair Ratio is a proprietary estimate of what Murphy USA’s P/E might be based on factors such as its earnings growth profile, industry, profit margins, market capitalization and key risks. Because it adjusts for these company specific features, it can offer a more tailored reference point than broad industry or peer averages alone. Comparing the current P/E of 19.6x with the Fair Ratio of 12.9x suggests Murphy USA stock is trading above this fair level.
Result: OVERVALUED

P/E ratios tell one story, but what if the real opportunity lies elsewhere? Start investing in legacies, not executives. Discover our 20 top founder-led companies.
Upgrade Your Decision Making: Choose your Murphy USA Narrative
Earlier the focus was on DCF and P/E checks, but an even more useful way to think about Murphy USA stock is through Narratives, which let you set out a clear story for the company, tie that story to explicit forecasts for revenue, earnings and margins, and see what fair value those assumptions imply.
In practice, a Narrative on Simply Wall St is your structured view of the company, hosted within the Community page. There you spell out how you think Murphy USA’s business will develop, connect that to a financial model, and then compare the resulting Fair Value with the current share price to assess whether the stock looks expensive or inexpensive against your own expectations.
Narratives on the platform are updated when new information such as earnings, buyback updates or analyst targets are added. As a result, your Murphy USA view does not stay static, and you can see how fair value estimates shift when, for example, bullish assumptions of a US$655.0 fair value or more cautious views closer to US$380.0 are revised as fresh data is incorporated.
For Murphy USA, here are previews of two leading Murphy USA Narratives:
Fair value: US$655.00
Implied discount to this fair value at the last close: about 10.4% above the narrative fair value
Revenue growth assumption: 10.91%
- Focuses on Murphy USA using a low cost fuel model, an active share buyback program and operating efficiency to support future earnings and cash generation.
- Builds on bullish analyst assumptions for revenue growth, earnings in 2029 and a higher future P/E multiple, alongside ongoing share count reduction and an 8.69% discount rate.
- Highlights risks around electric vehicle adoption, reliance on Walmart traffic, limited merchandise diversification, digital competition and execution on a sizeable new store pipeline.
Fair value: US$558.00
Implied premium to this fair value at the last close: about 5.2% above the narrative fair value
Revenue growth assumption: 8.05%
- Frames Murphy USA as supported by a value focused fuel model, loyalty programs and new sites, but with the current price close to the analyst consensus fair value.
- Builds on analyst assumptions for mid single digit annual revenue growth, slightly lower margins, a future P/E of 21.3x and continued buybacks, discounted at 8.79%.
- Points to headwinds from fuel volume pressures, mixed non fuel performance, execution risk in new store rollout, reliance on cost control and competition including EV charging.
If you want to go beyond these previews and see how other investors are framing the numbers for Murphy USA, it is worth reading the full community narratives alongside your own assumptions before making any decision.
Do you think there's more to the story for Murphy USA? Head over to our Community to see what others are saying!

This article by Simply Wall St is general in nature. We provide commentary based on historical data and analyst forecasts only using an unbiased methodology and our articles are not intended to be financial advice. It does not constitute a recommendation to buy or sell any stock, and does not take account of your objectives, or your financial situation. We aim to bring you long-term focused analysis driven by fundamental data. Note that our analysis may not factor in the latest price-sensitive company announcements or qualitative material. Simply Wall St has no position in any stocks mentioned.