MYR Group (MYRG) Stock Valuation After Supply Chain Relief Lifts Cyclical Sentiment
MYR Group Inc. MYRG | 0.00 |
Supply chain relief and MYR Group’s latest move
Signals of a possible resolution to the three month supply chain disruption linked to the Strait of Hormuz have lifted sentiment, with MYR Group (MYRG) climbing about 5% as cyclical stocks broadly rallied.
Beyond today’s move, MYR Group’s share price has a 90 day return of 66.7% and a year to date share price return of 96.6%. The 1 year total shareholder return of 172.8% points to strong momentum that has built over time.
If you are tracking how infrastructure and grid related stocks are reacting to shifting supply chain risks, it may be worth widening your watchlist to include 34 power grid technology and infrastructure stocks
The stock now trades close to its average analyst price target and above some intrinsic value estimates, yet its recent performance and growth figures are strong. Should you see this as froth, or is the market simply catching up to future growth pricing?
Most Popular Narrative: 2% Undervalued
At a last close of $445.72 versus a narrative fair value of $455.00, MYR Group is framed as slightly undervalued, with that view anchored in long dated contract visibility and margin assumptions.
Significant multi-year utility contracts (notably the new 5-year master service agreement with Xcel Energy and others in the Northeast/Midwest) are set to expand recurring revenues and improve backlog visibility, supporting higher future revenue and greater earnings predictability.
Read the complete narrative. Read the complete narrative.
Want to see what is baked into that fair value label? The narrative leans on compounding revenue, thicker margins, and a future earnings multiple that has to hold up. The exact mix of those ingredients may surprise you.
For context, the most followed narrative uses a discount rate of 8.79% and assumes that earnings, margins and the future P/E all work together to justify $455.00. Analysts in that framework see MYR Group growing revenue and profits, while the future P/E level applied to those projected earnings remains lower than some peers but still well above many mature infrastructure stocks.
Result: Fair Value of $455.00 (ABOUT RIGHT)
However, this hinges on backlog converting as expected and margins holding up, with labor cost inflation and C&I backlog volatility both capable of challenging that narrative.
Wall Street's queuing for one rocket. While SpaceX counts down to its IPO, other companies tied to the new space race are already in orbit. → 20 Compelling Space Companies watchlist · Global Space Race Investing Ideas screener · Scan the sector by valuation on Rocket Lab's valuation page.
Another View: Rich Earnings Multiple Raises the Bar
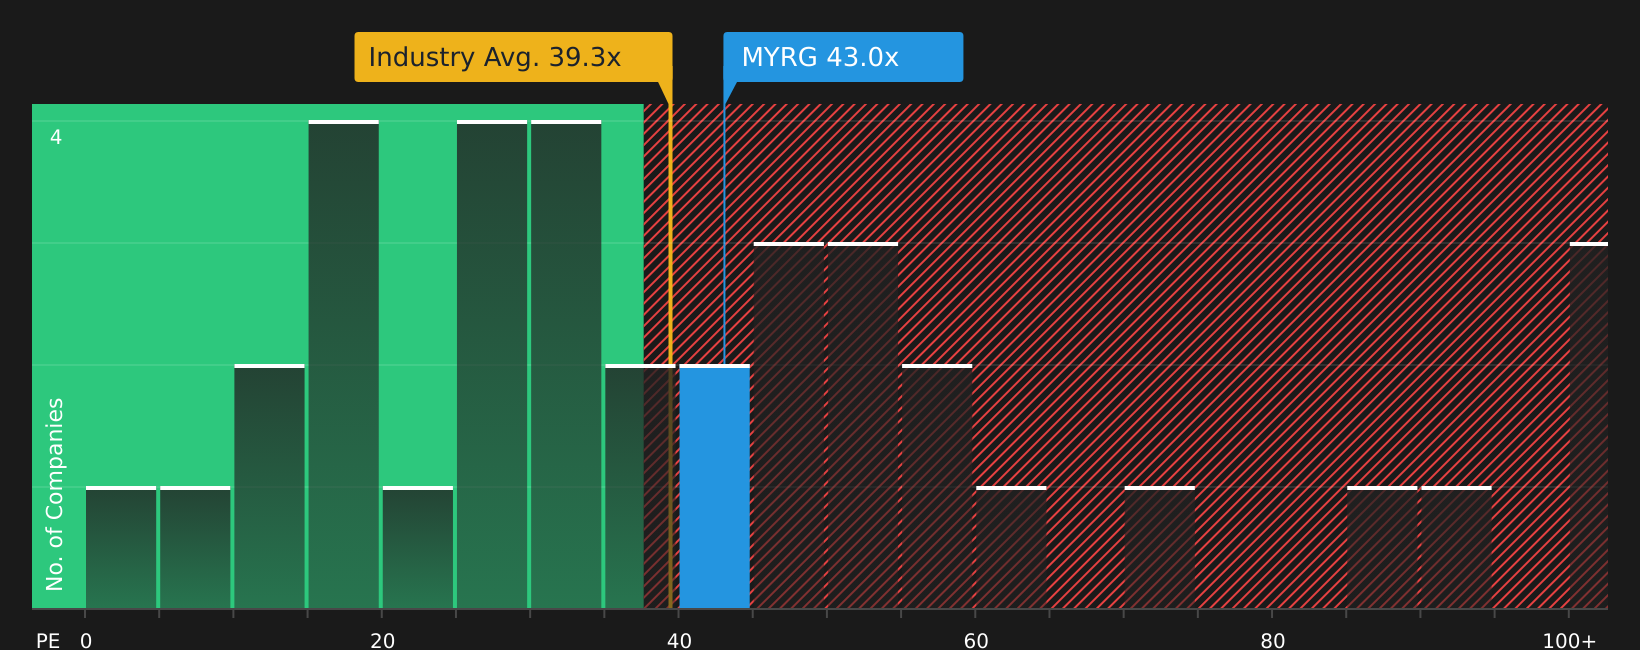
While the narrative fair value sits at $455.00, current pricing leans heavily on a rich earnings multiple. MYR Group trades on a P/E of 48.9x, compared with a fair ratio of 31.2x, the US Construction industry at 47.4x, and peers at 28x.
That gap means a lot of future growth is already reflected in the price. Any wobble in execution or sentiment could have an outsized effect on returns. Does that premium feel like a margin of safety or a margin of error?
Next Steps
With sentiment split between premium pricing and solid recent returns, it makes sense to look at the data yourself and move quickly to shape your own view using the 2 key rewards and 1 important warning sign.
Looking for more investment ideas?
Do not stop your research with a single stock; broaden your watchlist now so you can spot fresh opportunities early, before others start paying attention.
- Target income potential by scanning companies that consistently return cash to shareholders using the 8 dividend fortresses.
- Hunt for quality at a reasonable price with the 44 high quality undervalued stocks to see which stocks combine fundamentals with a discounted market tag.
- Prioritize resilience by filtering for companies with healthy finances through the solid balance sheet and fundamentals stocks screener (48 results).
This article by Simply Wall St is general in nature. We provide commentary based on historical data and analyst forecasts only using an unbiased methodology and our articles are not intended to be financial advice. It does not constitute a recommendation to buy or sell any stock, and does not take account of your objectives, or your financial situation. We aim to bring you long-term focused analysis driven by fundamental data. Note that our analysis may not factor in the latest price-sensitive company announcements or qualitative material. Simply Wall St has no position in any stocks mentioned.