Nasdaq (NDAQ) Stock After Recent Pullback Is The Valuation Now More Reasonable
Nasdaq, Inc. NDAQ | 0.00 |
How Nasdaq's Recent Moves Frame the Valuation Question
Before looking at detailed valuation models, it helps to understand what the recent share price and key metrics are already telling you about Nasdaq.
Over the past week the stock declined 7.6%, and it is down 8.6% over the last month and 14.9% year to date, even though the three year return sits at 72.7% and the five year return at 48.3%.
This pullback comes as investors continue to reassess listed market operators and financial infrastructure stocks more broadly, weighing long term structural demand against changing expectations for trading activity and deal volumes. While there has not been a single headline event driving the recent move, the price path gives you a starting point for thinking about how much of Nasdaq's long term potential is already reflected in the current US$82.24 share price.
On Simply Wall St's valuation framework, Nasdaq currently records a value score of 3/6, meaning it screens as undervalued on three of six checks, and the rest of this article will compare those different valuation approaches while also pointing to a broader way to think about the company's value story beyond just the numbers.
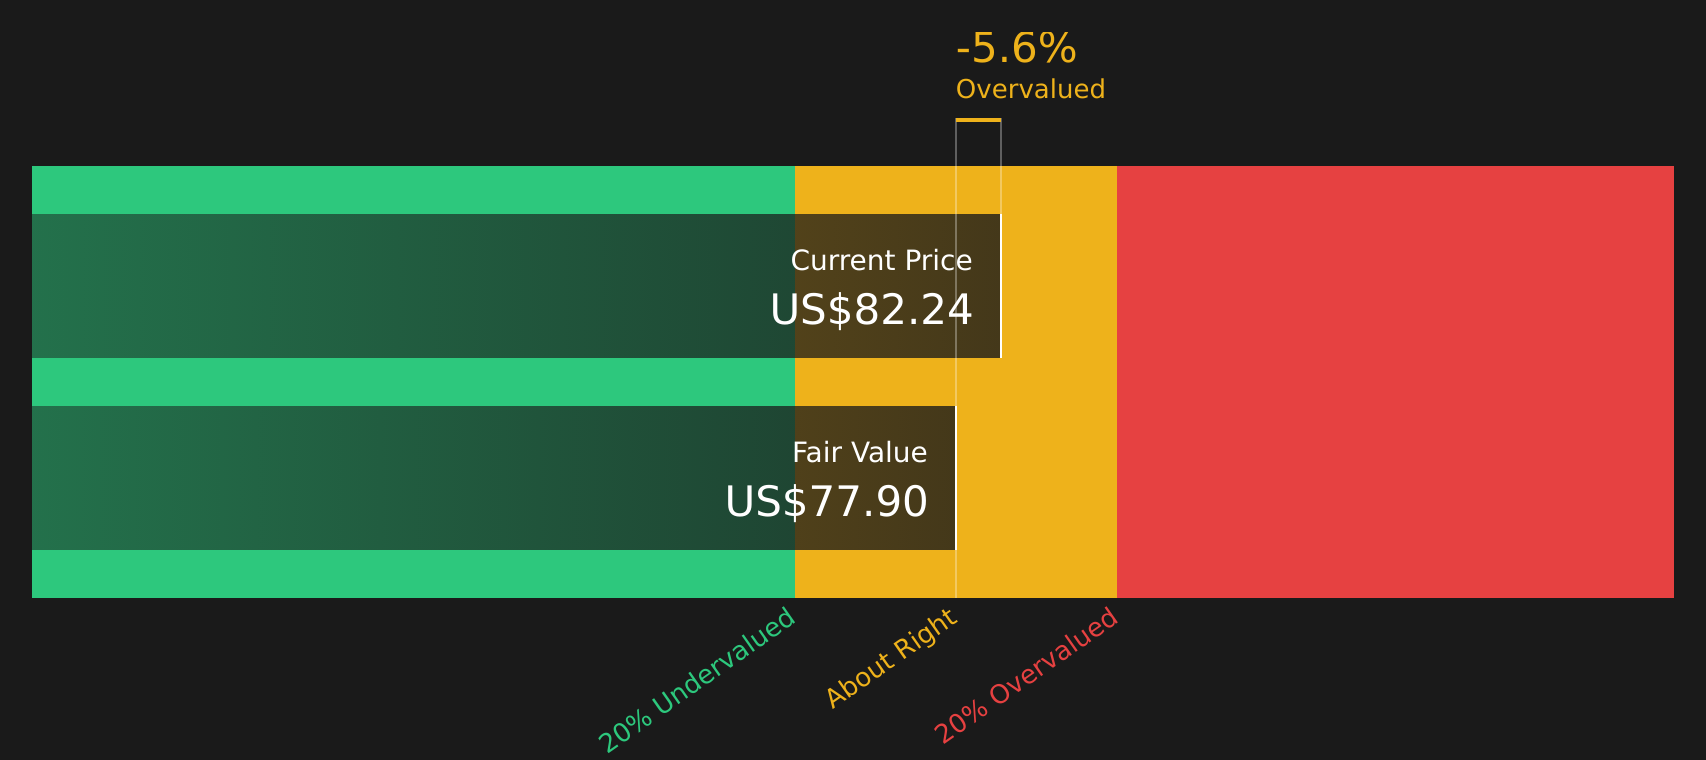
Approach 1: Nasdaq Excess Returns Analysis
The Excess Returns model asks a simple question for Nasdaq stock: does each dollar of shareholder capital earn more than investors require as compensation for risk, and if so, by how much?
For Nasdaq, the starting point is a Book Value of US$21.31 per share and an estimated Stable EPS of US$4.44 per share, based on weighted future return on equity estimates from 5 analysts. The implied Average Return on Equity is 19.35%, while the required Cost of Equity is US$1.88 per share. The difference between what the company is expected to earn and what investors require is an Excess Return of US$2.56 per share.
These excess profits are then projected forward on a Stable Book Value of US$22.94 per share, sourced from weighted future book value estimates from 3 analysts, and discounted back to today to give an intrinsic value estimate of US$77.90 per share. Compared with the current US$82.24 share price, the model suggests Nasdaq is about 5.6% overvalued, which is a relatively small gap.
Result: ABOUT RIGHT
Nasdaq is fairly valued according to our Excess Returns, but this can change at a moment's notice. Track the value in your watchlist or portfolio and be alerted on when to act.
Approach 2: Nasdaq Price vs Earnings
For a profitable company like Nasdaq, the P/E ratio is a useful shorthand for how much investors are willing to pay today for each dollar of current earnings. It ties the share price directly to the company’s earnings power, which is central for a mature, consistently profitable business.
What counts as a “normal” or “fair” P/E ratio depends on what investors expect for future earnings growth and how much risk they see in those earnings. Higher expected growth or lower perceived risk usually supports a higher P/E, while slower growth or higher risk tends to justify a lower multiple.
Nasdaq currently trades at a P/E of 24.33x. That sits below the broader Capital Markets industry average of 40.55x and also below the peer group average of 26.03x. Simply Wall St’s Fair Ratio for Nasdaq is 16.71x, which is a proprietary estimate of what P/E might be appropriate given factors such as earnings growth, industry, profit margins, market cap and risks. Because the Fair Ratio is tailored to the company’s own profile rather than broad group averages, it offers a more company specific view than simple peer or industry comparisons. With Nasdaq’s actual P/E above the Fair Ratio, the shares screen as overvalued on this metric.
Result: OVERVALUED

P/E ratios tell one story, but what if the real opportunity lies elsewhere? Start investing in legacies, not executives. Discover our 20 top founder-led companies.
Upgrade Your Decision Making: Choose your Nasdaq Narrative
Earlier it was mentioned that there is an even better way to understand what Nasdaq might be worth. Narratives on Simply Wall St let you attach a clear story to the numbers by linking your view on the company’s future revenue, earnings and margins to a forecast and then to a fair value. This is provided in an easy tool on the Community page that updates automatically when fresh news or earnings arrive. You can use it to compare that Fair Value with today’s price to decide whether the stock looks attractive, with different investors naturally landing on very different Narratives, such as a more optimistic view that supports a Fair Value around US$120 or a cautious view closer to US$82, based on the same shared data but different expectations.
Do you think there's more to the story for Nasdaq? Head over to our Community to see what others are saying!

This article by Simply Wall St is general in nature. We provide commentary based on historical data and analyst forecasts only using an unbiased methodology and our articles are not intended to be financial advice. It does not constitute a recommendation to buy or sell any stock, and does not take account of your objectives, or your financial situation. We aim to bring you long-term focused analysis driven by fundamental data. Note that our analysis may not factor in the latest price-sensitive company announcements or qualitative material. Simply Wall St has no position in any stocks mentioned.