Nasdaq & S&P 500 Near "Buy" Window After Three-Month Correction?
S&P 500 index SPX | 6584.37 | +0.86% |
NASDAQ IXIC | 21869.27 | +1.29% |
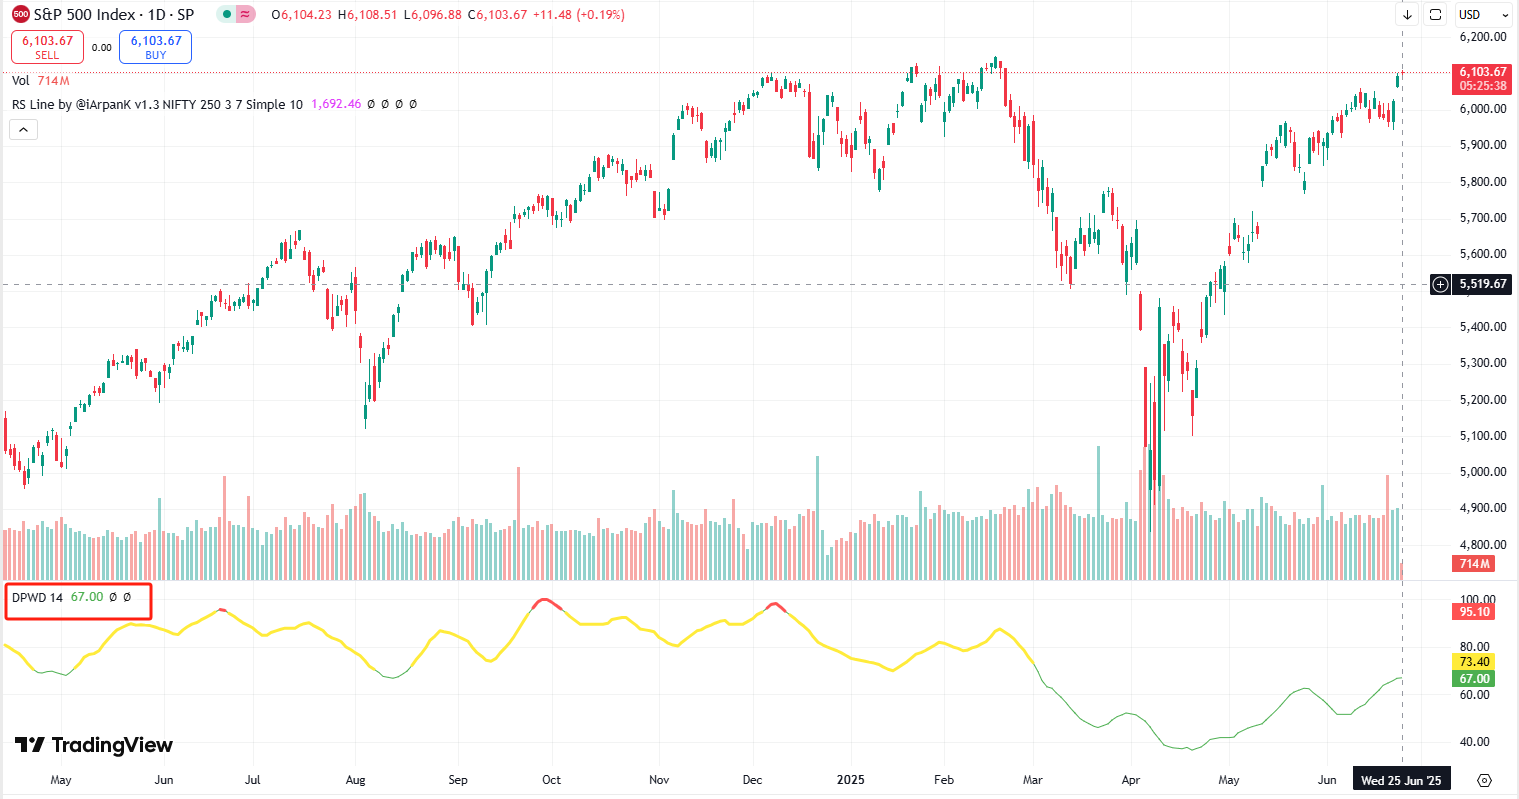
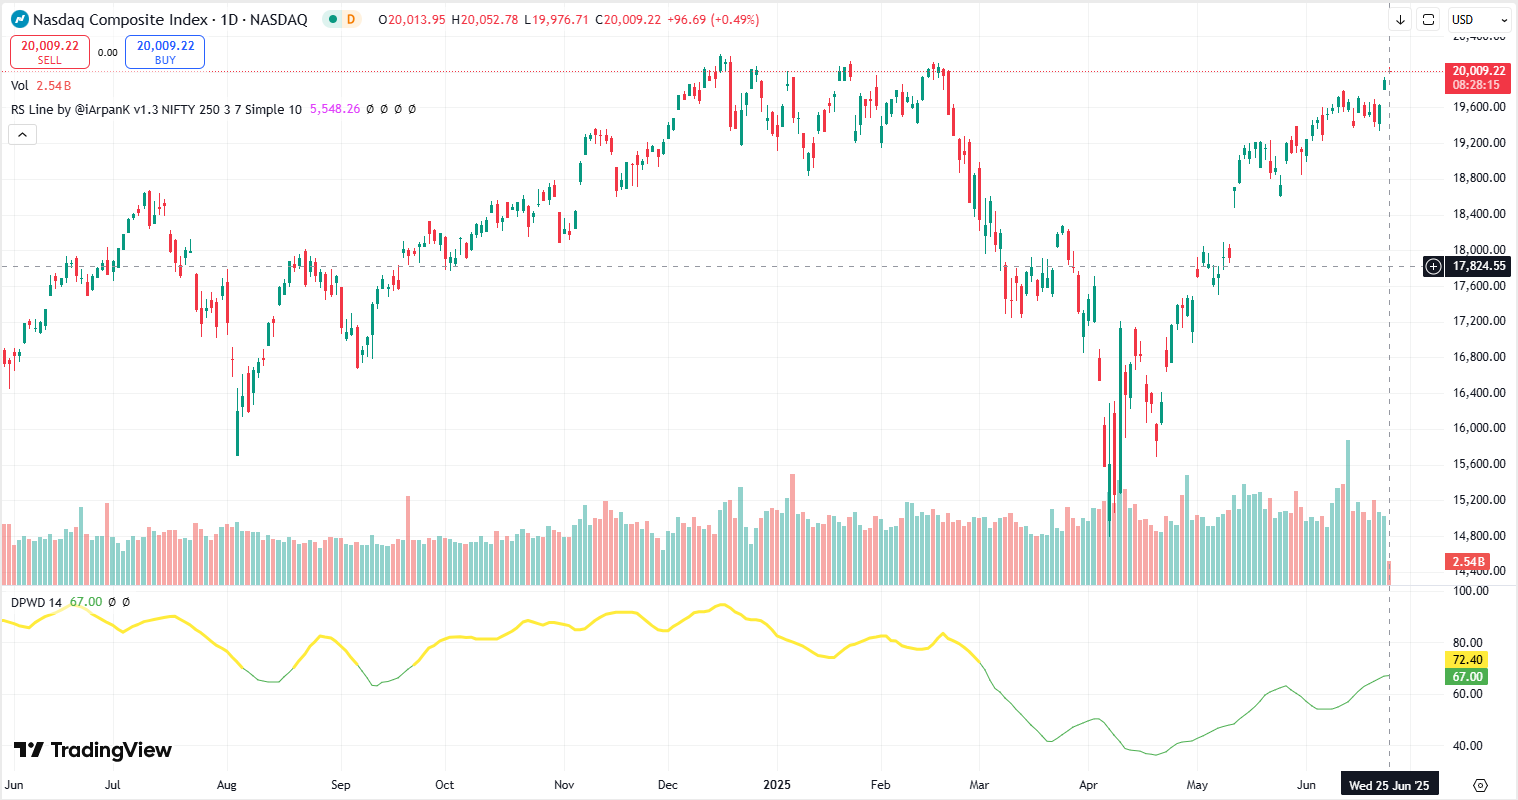
Based on our technical observation indicators, among the three major U.S. stock indices, the S&P 500 index(SPX.US) and NASDAQ(IXIC.US) are now approaching the "long" threshold.
Our indicators show that on June 25, the technical indicator values for both the S&P 500 and Nasdaq reached 67, nearing the 70 threshold that signals a "long" signal.
Back in March, we noted in our article "Indicators Show US Major Indices May Enter a Technical Bear Market" and "Rebound? Technical Indicators Show US Stocks Still Struggling" that U.S. equities had entered bearish territory. Following the U.S. tariff escalation in April, the three major indices saw peak-to-trough declines exceeding 15%. After three months of recovery, we are now seeing early signs of a long setup.
However, it should be noted that the sustainability of this V-shaped rebound remains to be confirmed.