New Oriental Education Q2 Net Margin Compression Challenges Bullish Growth Narrative
New Oriental Education & Technology Group, Inc. Sponsored ADR EDU | 56.42 | -0.83% |
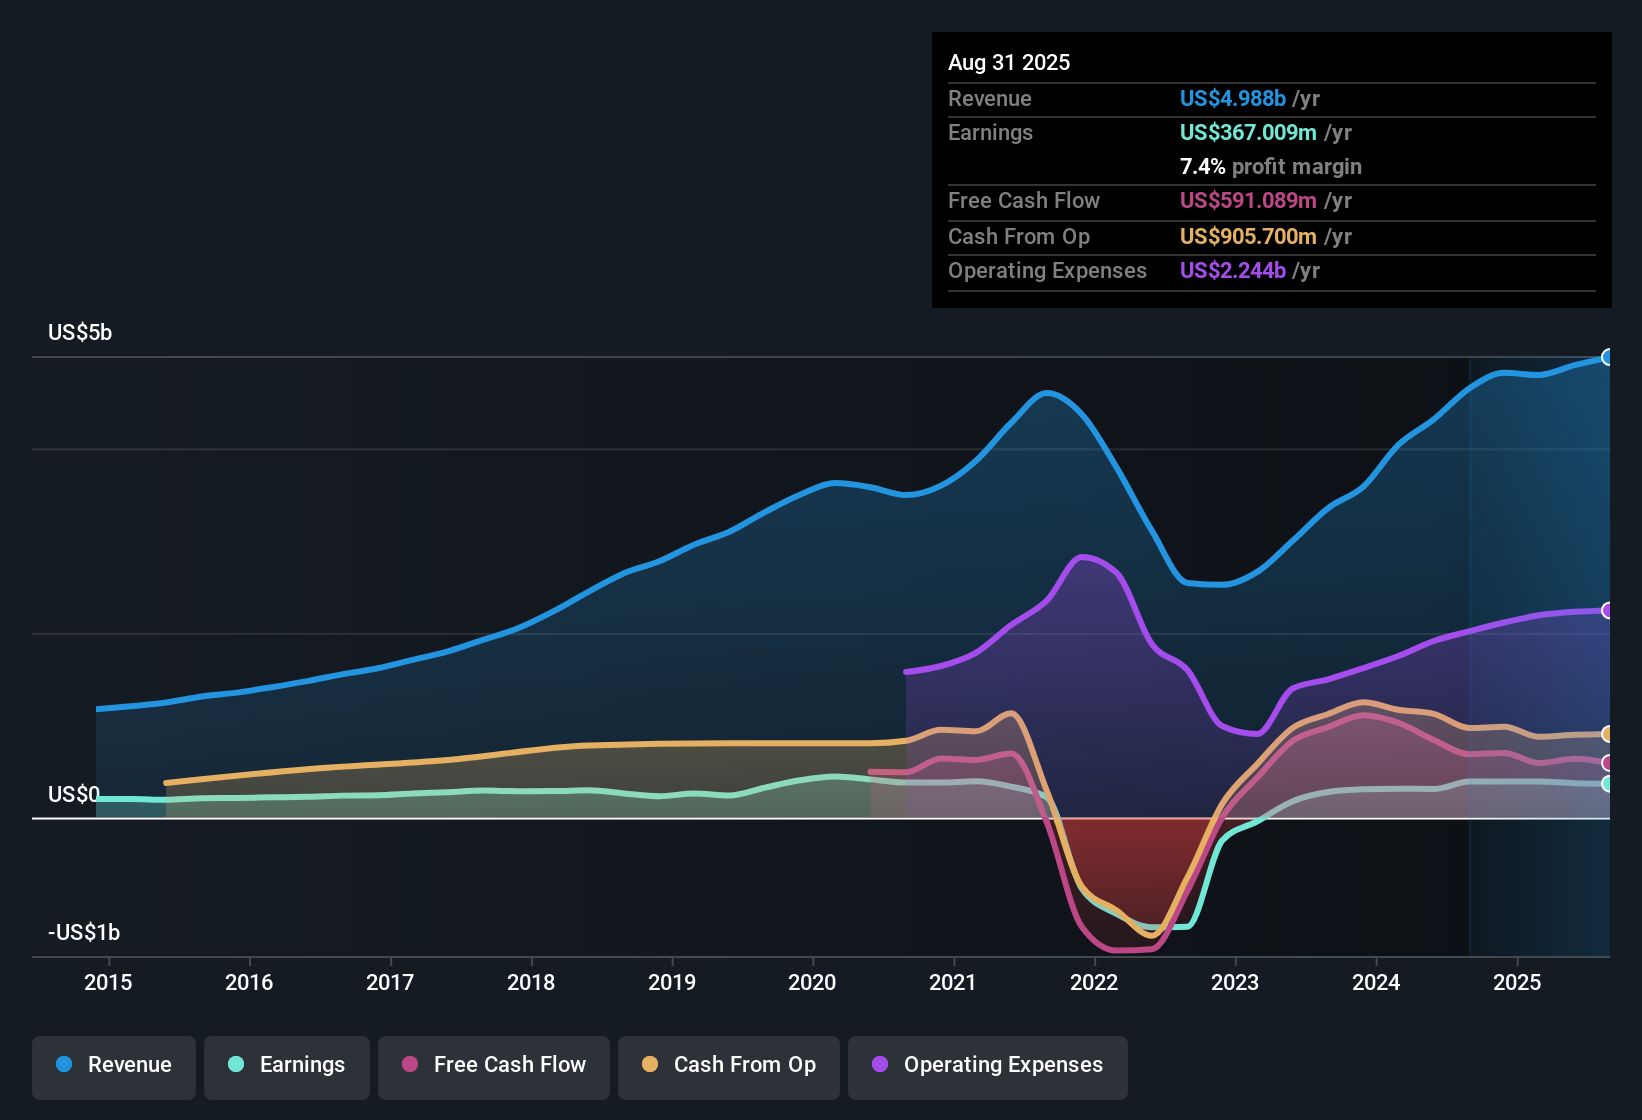
New Oriental Education & Technology Group (NYSE:EDU) has put fresh numbers on the table for Q2 2026, with revenue of US$1.2b and basic EPS of US$0.30, against a backdrop of trailing twelve month revenue of US$5.1b and EPS of US$2.38. The company has seen quarterly revenue move between US$1.0b and US$1.5b over the last six reported periods, while basic EPS has ranged from US$0.04 to about US$1.52. This gives investors a clear view of how earnings power has fluctuated as revenue has scaled. With a trailing net margin of 7.4% and forecasts pointing to both earnings and revenue growth, this set of results puts profitability and its durability firmly in focus.
See our full analysis for New Oriental Education & Technology Group.With the latest figures on the board, the next step is to see how these results line up against the dominant narratives around EDU’s growth, risks, and profitability, and where the numbers may be starting to tell a different story.
TTM earnings of US$380.5m sit against a recent loss year
- Over the last twelve months, New Oriental reported net income of US$380.5m and basic EPS of US$2.38, while the risk summary also flags that earnings were loss making over the most recent year when compared with the five year earnings growth rate of 31.5% per year.
- What stands out for a bullish view that focuses on that 31.5% annual earnings growth over five years is the contrast with the weaker trailing year, as the latest quarterly net income figures move from US$245.4m in Q1 2025 to US$45.5m in Q2 2026, which:
- Supports the idea that the business has produced sizeable profits in several quarters, given TTM net income of US$380.5m across US$5.1b of revenue.
- At the same time challenges a simple bullish read, because the risk summary explicitly notes that trailing year earnings were negative versus that longer term growth rate, so investors need to reconcile the strong multi year compounding with that weaker recent period.
Margins at 7.4% with Q2 profit of US$45.5m
- The trailing net margin sits at 7.4% on US$5.1b of revenue, while Q2 2026 net income of US$45.5m on US$1.2b of revenue shows profitability for the period alongside earlier quarters like Q1 2026, which recorded US$240.7m of net income on US$1.5b of revenue.
- Critics who focus on profitability risks point to the margin move from 8.1% to 7.4% and the weaker trailing year, and the quarterly pattern highlights why this bearish angle has some traction and also some limits:
- The margin compression in the trailing numbers backs the concern that profitability has been tighter recently, even though the company is still reporting TTM net income of US$380.5m.
- At the same time, the presence of multiple profitable quarters, including Q3 2025 net income of US$87.3m and Q4 2025 net income of US$7.1m, shows the business has not shifted into a consistently loss making profile in this dataset.
P/E of 24.7x and DCF fair value of US$125.02
- The shares trade at US$58.95 with a trailing P/E of 24.7x, compared with the US Consumer Services industry at 16.7x and peer average of 26.5x, while a DCF fair value of US$125.02 per share is about 52.8% above the current price.
- Supporters of the bullish view tend to lean on the gap between price and DCF fair value alongside the growth forecasts, and the numbers here give that angle some clear talking points as well as a few checks:
- The stated DCF fair value of US$125.02 versus a share price of US$58.95 lines up with the reward summary that sees material upside based on that model, especially with earnings forecast to grow about 15.8% per year and revenue about 8.7% per year.
- However, the fact that the P/E of 24.7x sits above the broader US Consumer Services average of 16.7x, even if slightly below peers at 26.5x, gives bears a valuation counterpoint when they link the richer multiple to the recent margin decline from 8.1% to 7.4%.
Next Steps
Don't just look at this quarter; the real story is in the long-term trend. We've done an in-depth analysis on New Oriental Education & Technology Group's growth and its valuation to see if today's price is a bargain. Add the company to your watchlist or portfolio now so you don't miss the next big move.
See What Else Is Out There
EDU’s recent pattern of a weaker trailing year, softer margins at 7.4%, and uneven quarterly profits may leave you wanting a smoother earnings profile.
If you prefer companies with more consistent momentum, check out our stable growth stocks screener (2166 results) to focus on businesses that aim for steadier revenue and earnings through different conditions.
This article by Simply Wall St is general in nature. We provide commentary based on historical data and analyst forecasts only using an unbiased methodology and our articles are not intended to be financial advice. It does not constitute a recommendation to buy or sell any stock, and does not take account of your objectives, or your financial situation. We aim to bring you long-term focused analysis driven by fundamental data. Note that our analysis may not factor in the latest price-sensitive company announcements or qualitative material. Simply Wall St has no position in any stocks mentioned.