

NIO (NIO) Is Down 14.8% After Profitability Milestones And Premium Mix Shift - Has The Bull Case Changed?
NIO NIO | 0.00 |
- NIO Inc. has reported its first quarter 2026 results, with revenue rising to CNY 25,532.66 million, net loss narrowing to CNY 496.01 million, and guidance for second quarter 2026 pointing to revenues of roughly US$4.75 billion–US$4.99 billion on 110,000–115,000 vehicle deliveries.
- Beyond the headline growth, the company’s second consecutive quarter of adjusted profitability, higher-margin ES8 mix, and the launch of the flagship ES9 and ONVO L80 suggest a business increasingly focused on improving economics rather than pure volume.
- With that in mind, we’ll now examine how NIO’s strong Q1 delivery growth and narrower losses may reshape its existing investment narrative.
Find 49 companies with promising cash flow potential yet trading below their fair value.
NIO Investment Narrative Recap
To own NIO, you have to believe its mix of premium EVs, battery swap infrastructure, and multi-brand lineup can turn rapid delivery growth into durable profitability. The key near term catalyst is the company’s ability to sustain positive non GAAP operating profit while scaling new models. Q1 2026’s sharply narrower net loss and strong Q2 revenue and delivery guidance help here, but execution risks in a competitive Chinese EV market remain central.
Among recent developments, NIO’s Q2 2026 guidance stands out: revenue of RMB 32,777 million to RMB 34,436 million (about US$4,752 million to US$4,992 million) on 110,000 to 115,000 vehicle deliveries. This follows Q1’s 83,465 deliveries and 19% gross margin, reinforcing the delivery growth and margin improvement that many investors see as the main catalyst for closing the gap between strong top line momentum and persistent net losses.
Yet, alongside this improving picture, the risk that rising raw material costs and intense price competition could pressure NIO’s targeted 17% to 18% vehicle margins is something investors should be aware of...
NIO’s narrative projects CN¥148.4 billion revenue and CN¥7.5 billion earnings by 2028. This requires 28.8% yearly revenue growth and a CN¥31.8 billion earnings increase from CN¥-24.3 billion today.
Uncover how NIO's forecasts yield a $6.49 fair value, a 25% upside to its current price.
Exploring Other Perspectives
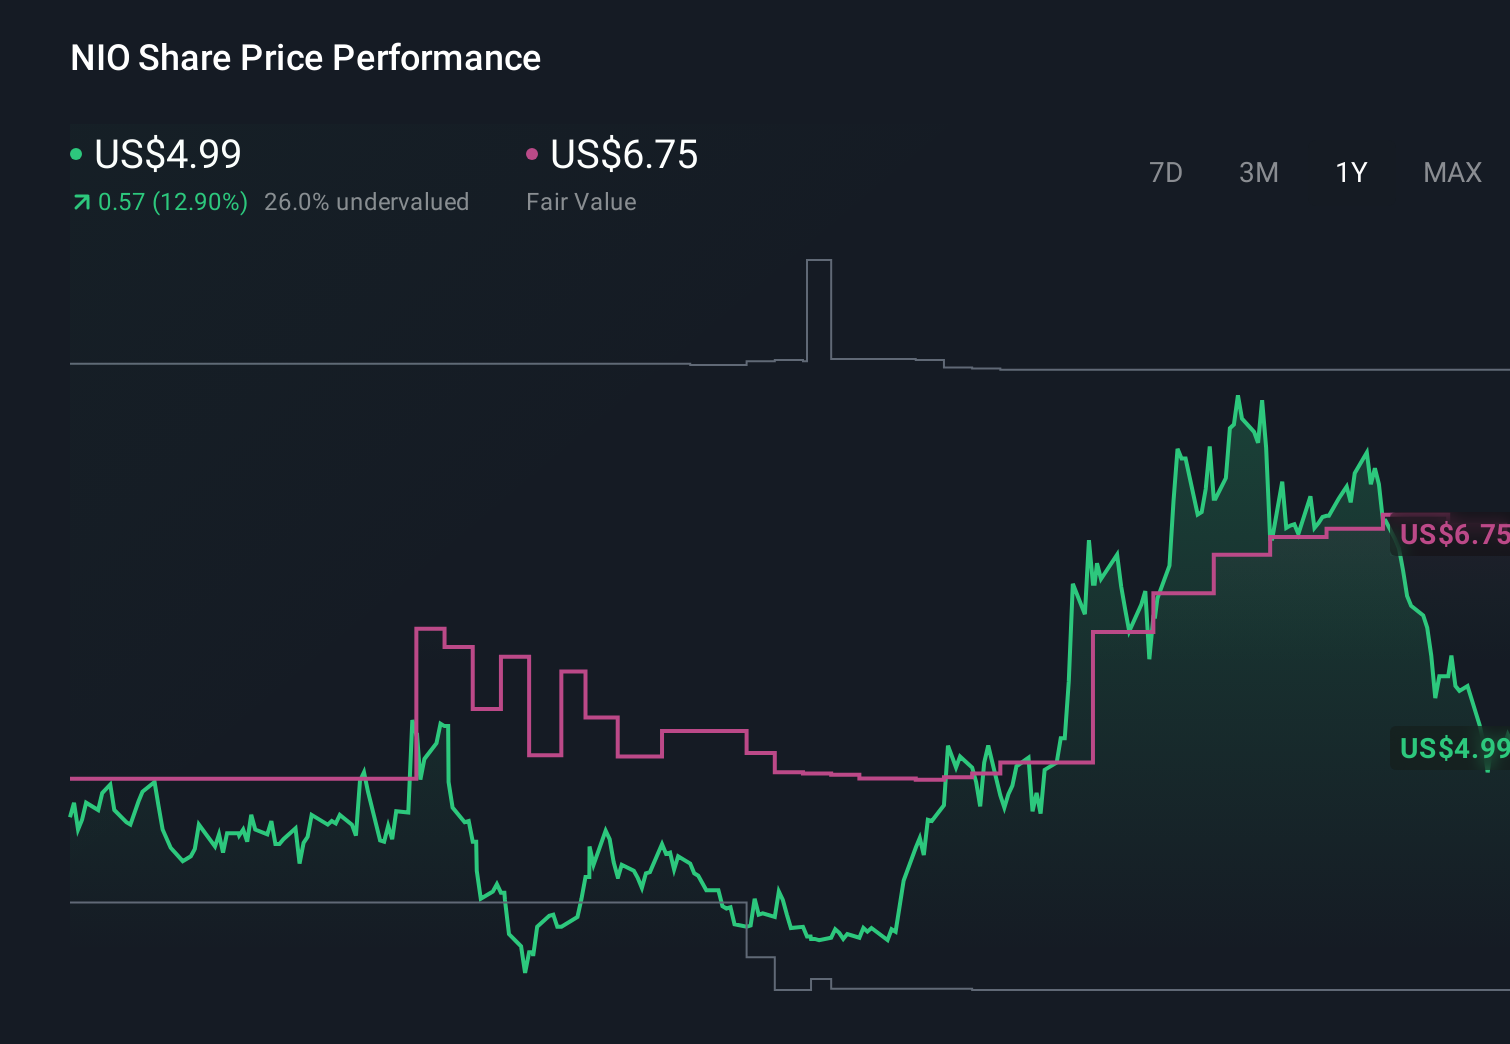
Some of the most optimistic analysts were already penciling in revenue growth of about 44 percent a year and CN¥10.5 billion in earnings by 2028, which is far more upbeat than the baseline view. After a quarter like this, you can see why opinions range so widely, and why it is worth comparing these bullish assumptions with your own expectations about supply chain constraints and NIO’s ability to sustain higher margins over time.
Explore 10 other fair value estimates on NIO - why the stock might be worth 19% less than the current price!
Form Your Own Verdict
Don't just follow the ticker - dig into the data and build a conviction that's truly your own.
- A great starting point for your NIO research is our analysis highlighting 1 key reward that could impact your investment decision.
- Our free NIO research report provides a comprehensive fundamental analysis summarized in a single visual - the Snowflake - making it easy to evaluate NIO's overall financial health at a glance.
Looking For Alternative Opportunities?
Every day counts. These free picks are already gaining attention. See them before the crowd does:
- Invest in the nuclear renaissance through our list of 88 elite nuclear energy infrastructure plays powering the global AI revolution.
- Capitalize on the AI infrastructure supercycle with our selection of the 46 best 'picks and shovels' of the AI gold rush converting record-breaking demand into massive cash flow.
- AI is about to change healthcare. These 34 stocks are working on everything from early diagnostics to drug discovery. The best part - they are all under $10b in market cap - there's still time to get in early.
This article by Simply Wall St is general in nature. We provide commentary based on historical data and analyst forecasts only using an unbiased methodology and our articles are not intended to be financial advice. It does not constitute a recommendation to buy or sell any stock, and does not take account of your objectives, or your financial situation. We aim to bring you long-term focused analysis driven by fundamental data. Note that our analysis may not factor in the latest price-sensitive company announcements or qualitative material. Simply Wall St has no position in any stocks mentioned.